class: center, middle, inverse, title-slide # Laboratorio Bio-demografico ## Lezione 2 ### Nicola Barban <br> Alma Mater Studiorum Università di Bologna <br> Dipartimento di Scienze Statistiche ### 17 Febbraio 2021<br> <img src="../img/UniBo-Universita-di-Bologna.png" style="width:20.0%" /> --- # Outline * Rstudio * Introduzione a R https://rstudio.com/wp-content/uploads/2016/10/r-cheat-sheet-3.pdf https://github.com/rstudio/cheatsheets/raw/master/rstudio-ide.pdf --- # Download & install Rstudio 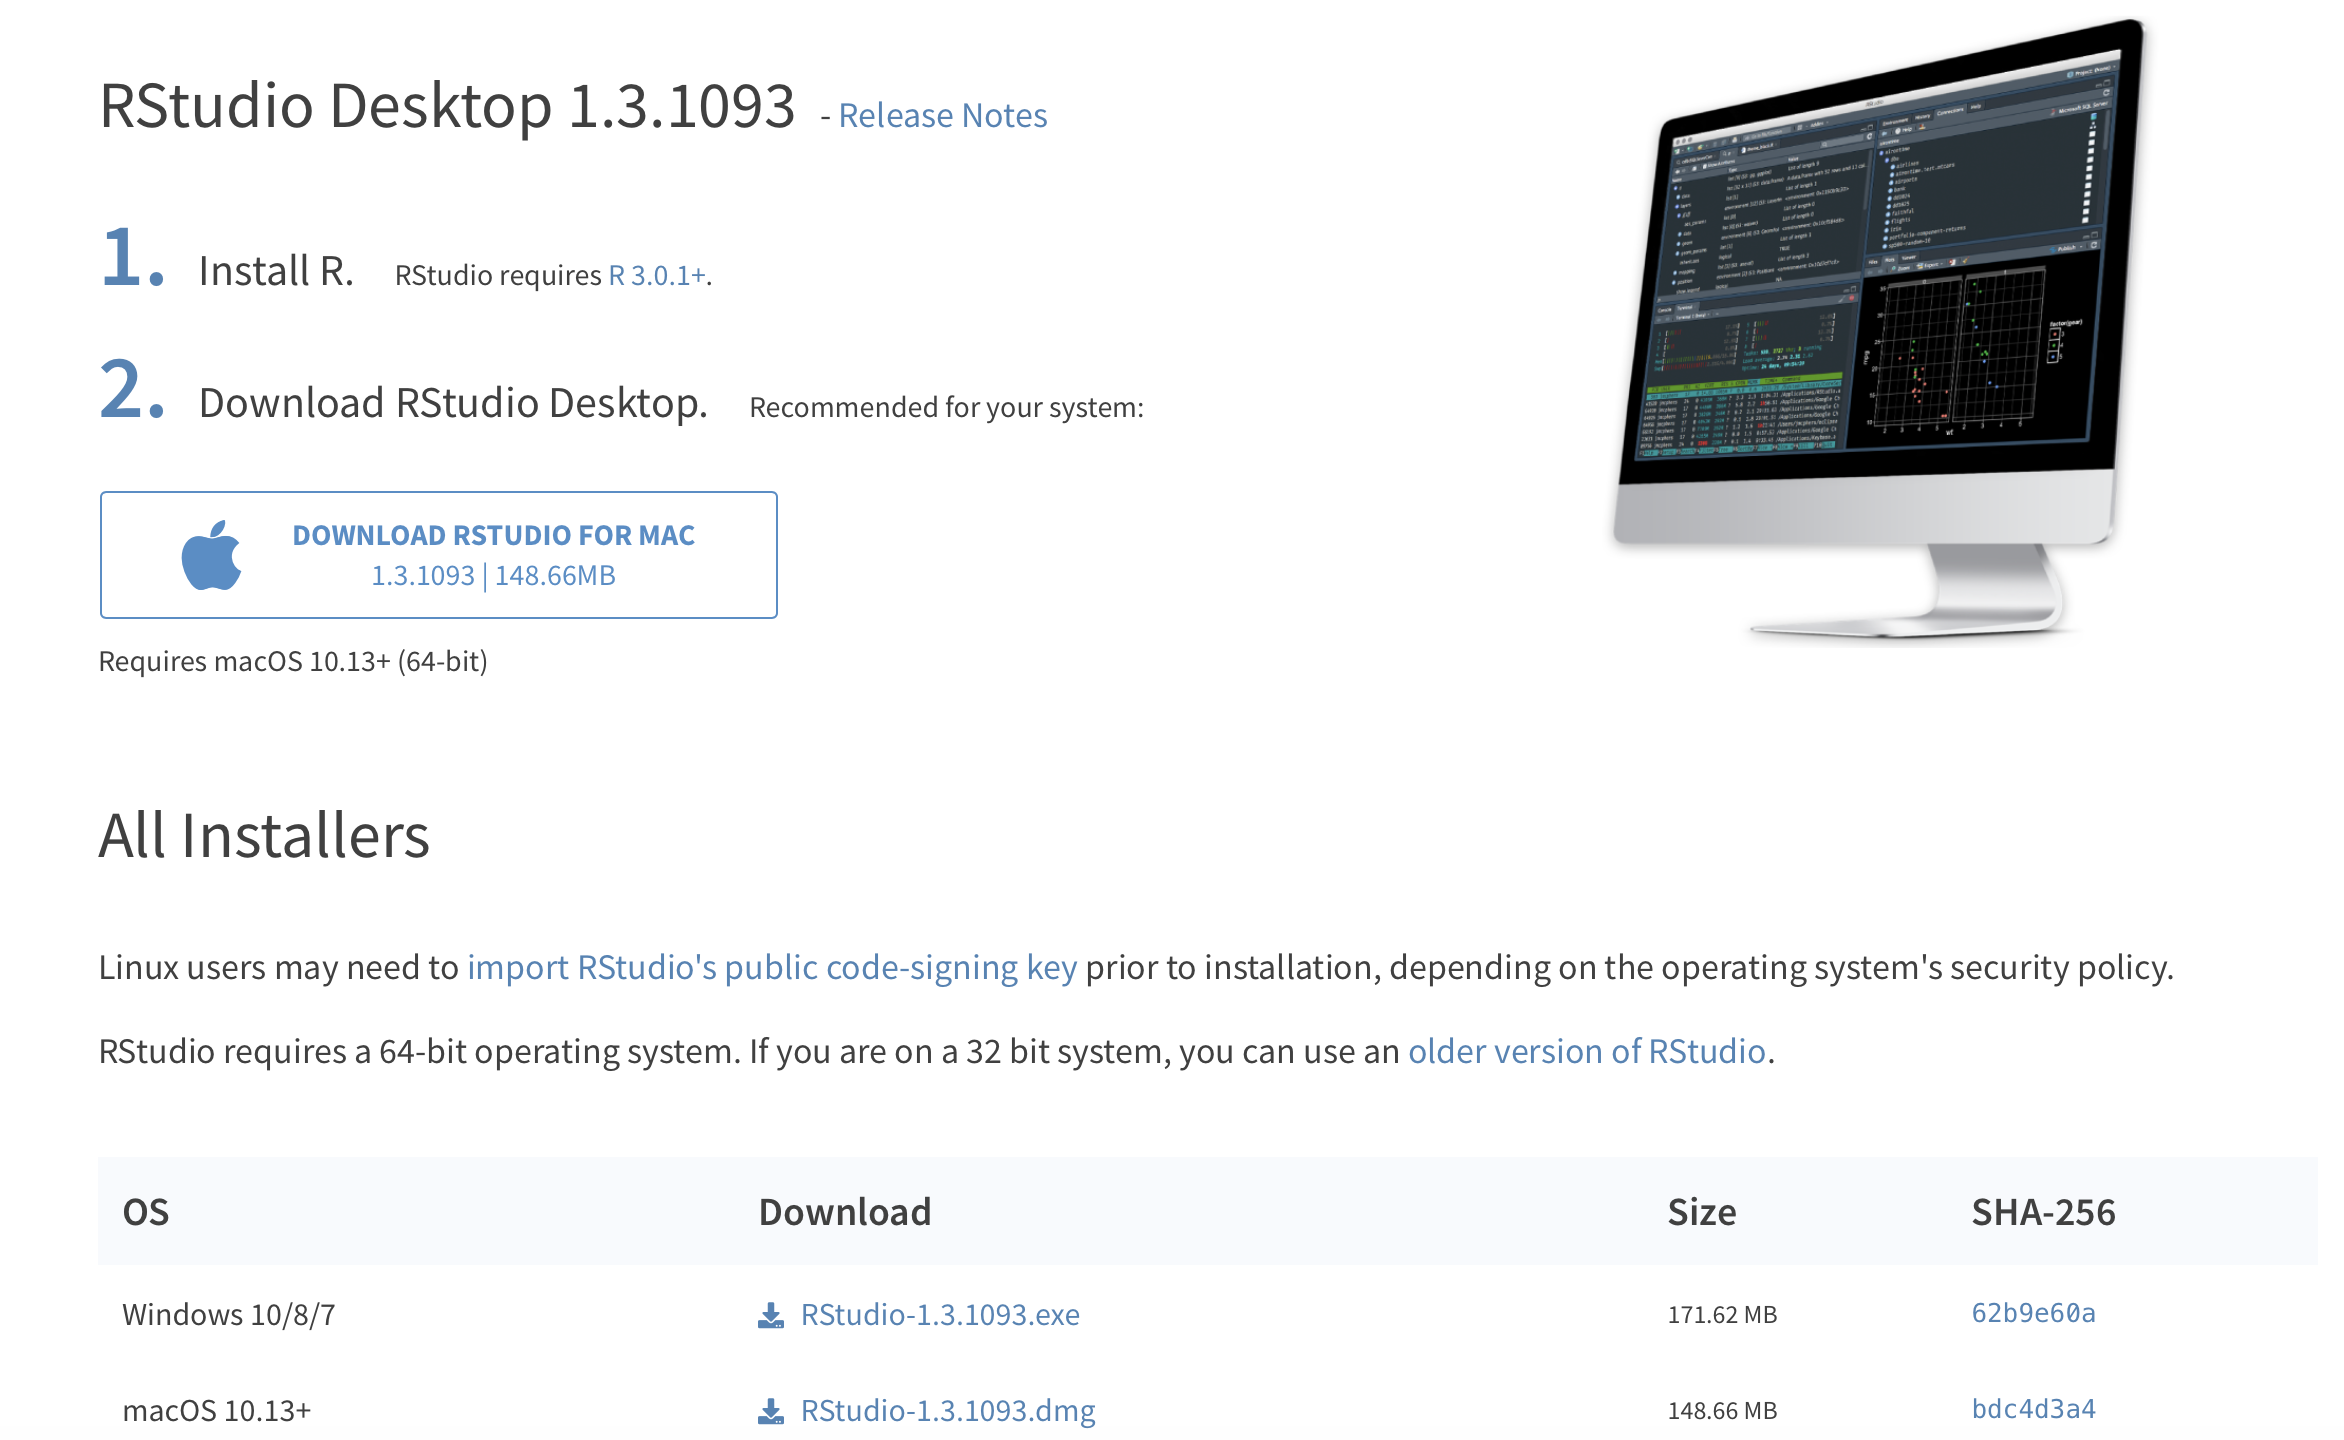 --- # Rstudio 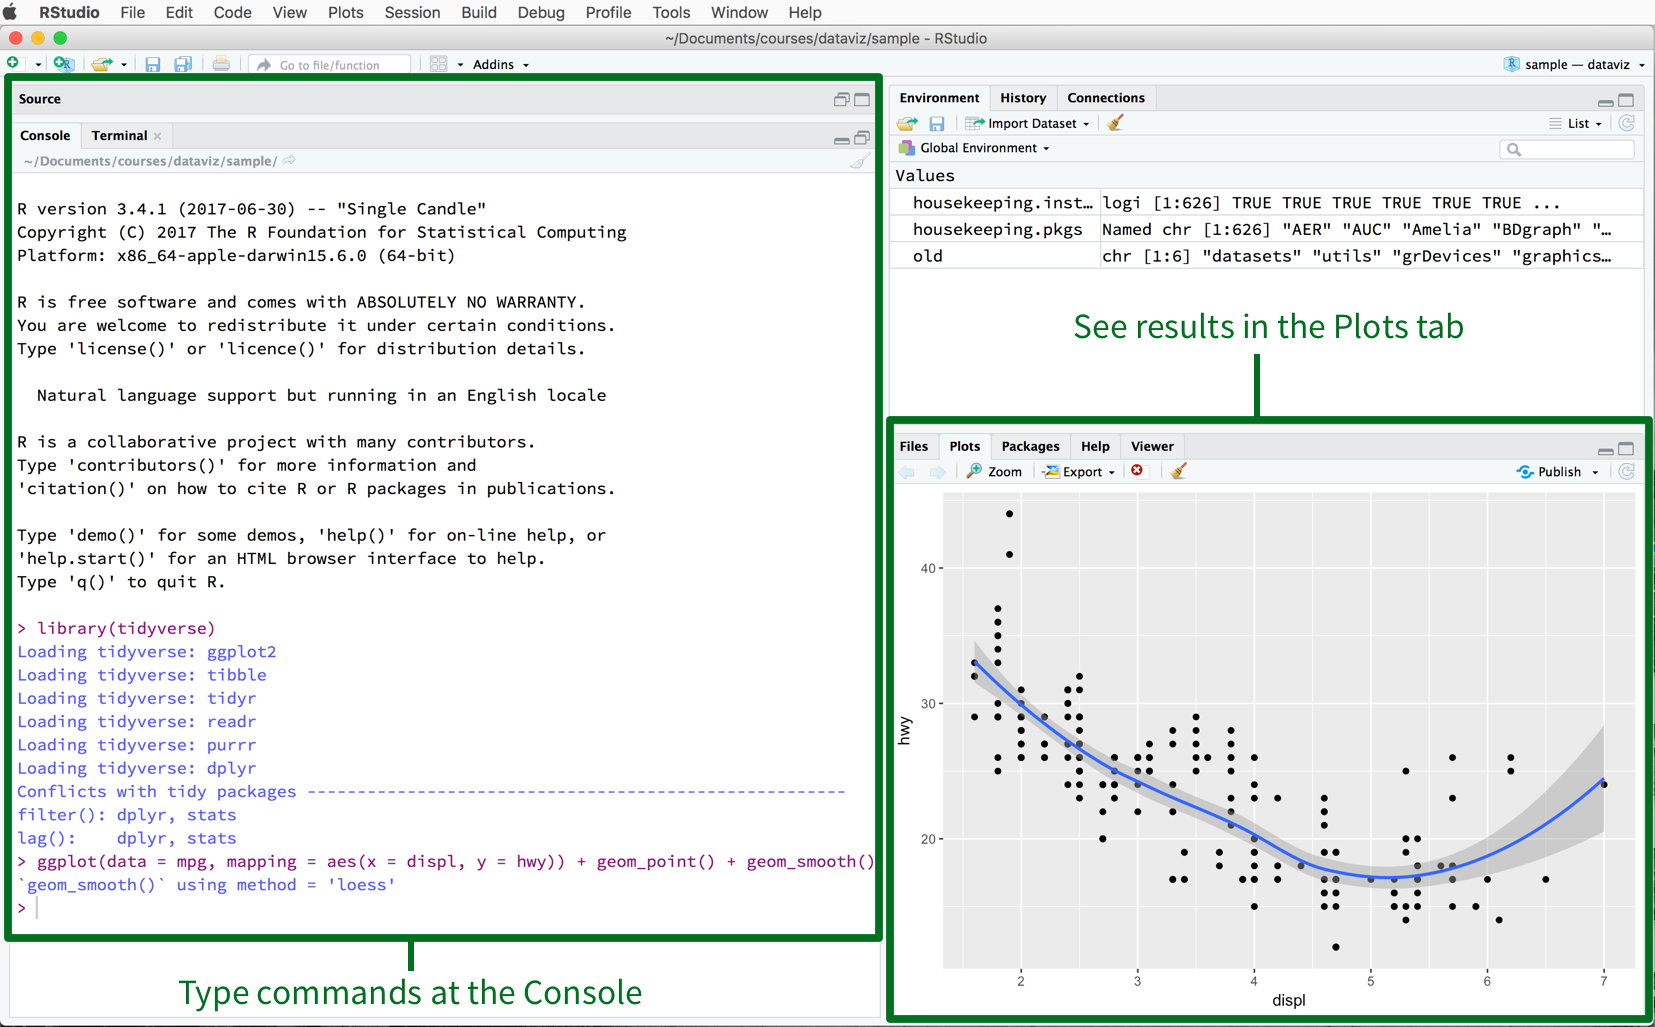 --- 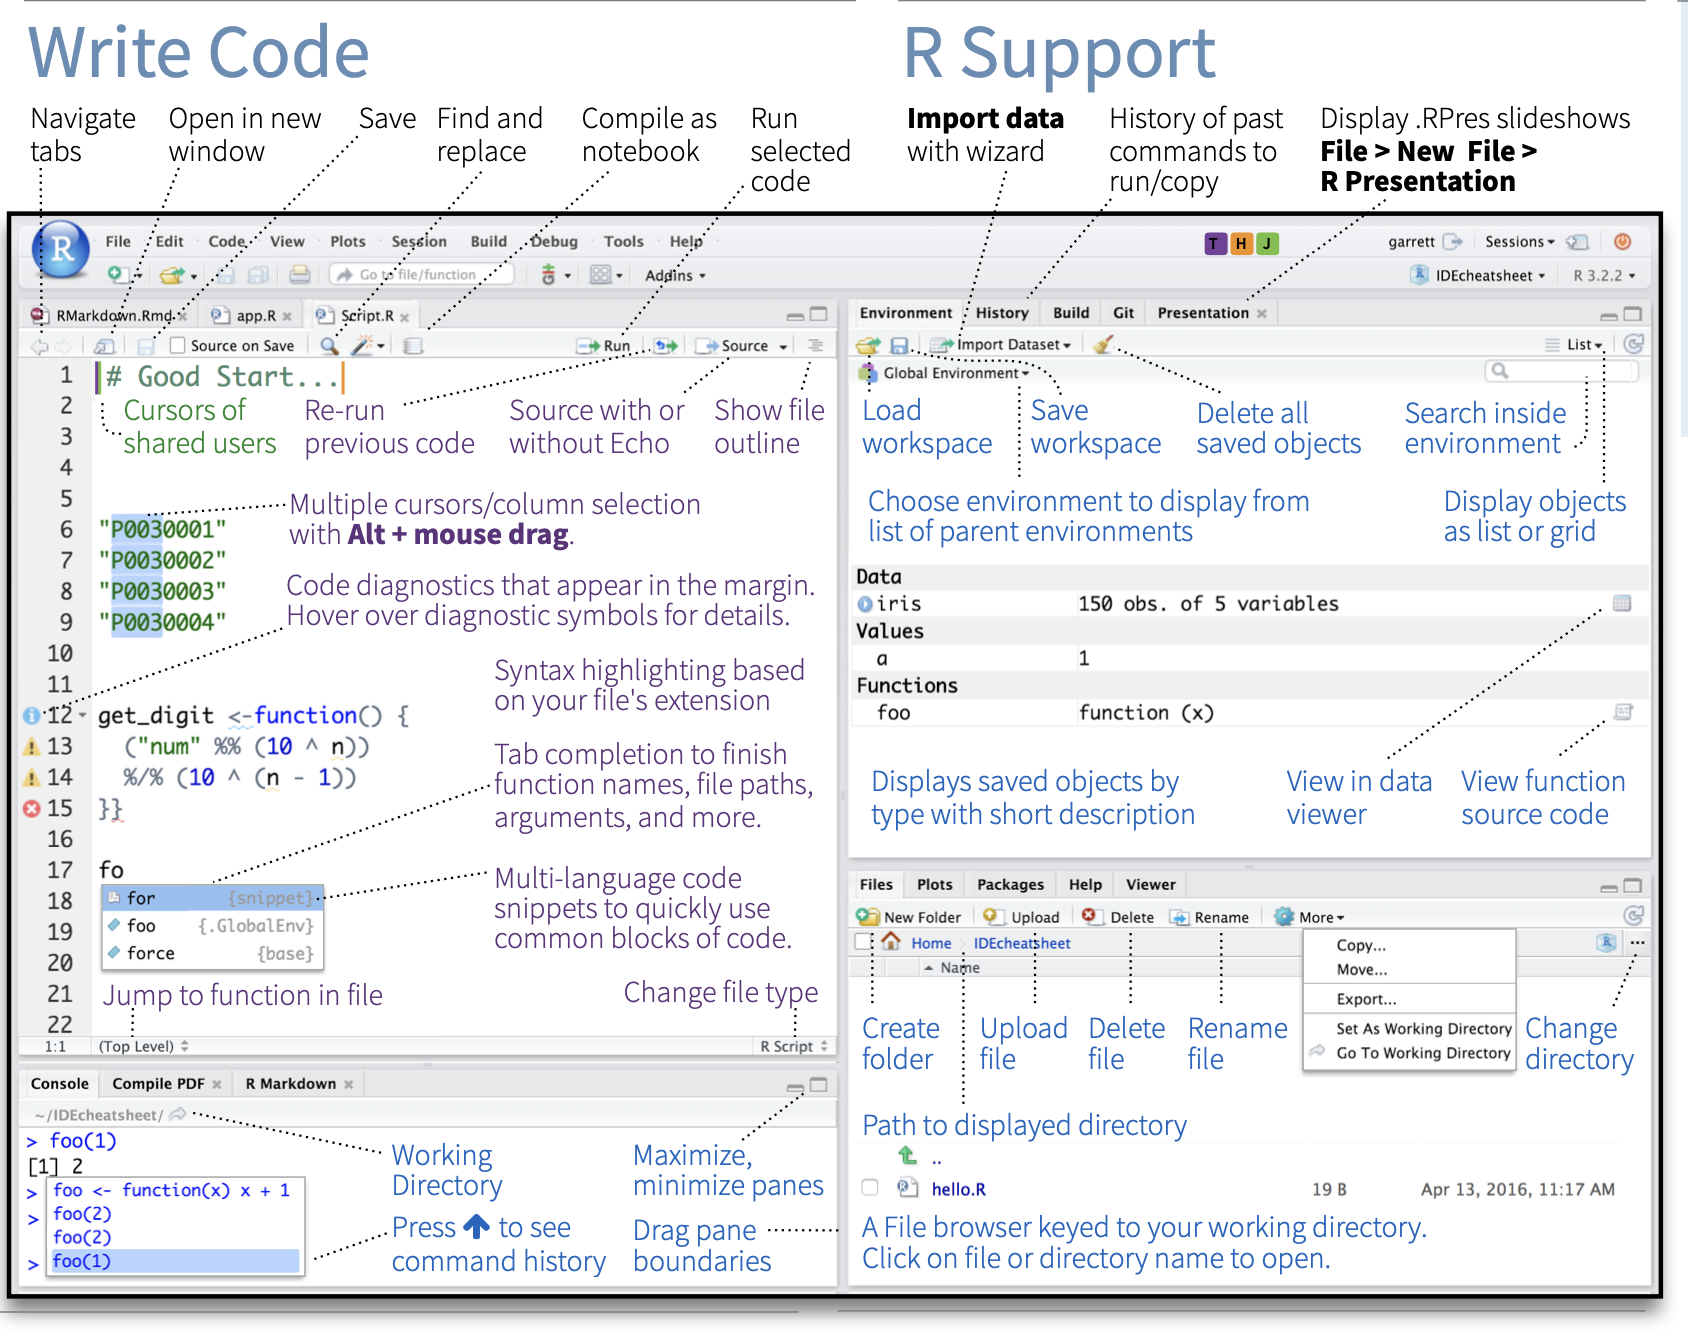 --- # R come calcolatrice ```r # IO SONO UN COMMENTO! ## Operazioni base 5+2 ``` ``` ## [1] 7 ``` -- ```r *a<- 5 ``` -- ```r a+3 ``` ``` ## [1] 8 ``` ```r 5*(a+5) ``` ``` ## [1] 50 ``` --- # operatori logici ```r b <-3 *a== b ``` ``` ## [1] FALSE ``` -- ```r # operatori logici a & b ``` ``` ## [1] TRUE ``` ```r a < b ``` ``` ## [1] FALSE ``` ```r a > b ``` ``` ## [1] TRUE ``` ```r b >= 3 ``` ``` ## [1] TRUE ``` -- ```r # virgola con il punto *#1,25+0 1.25 ``` ``` ## [1] 1.25 ``` --- 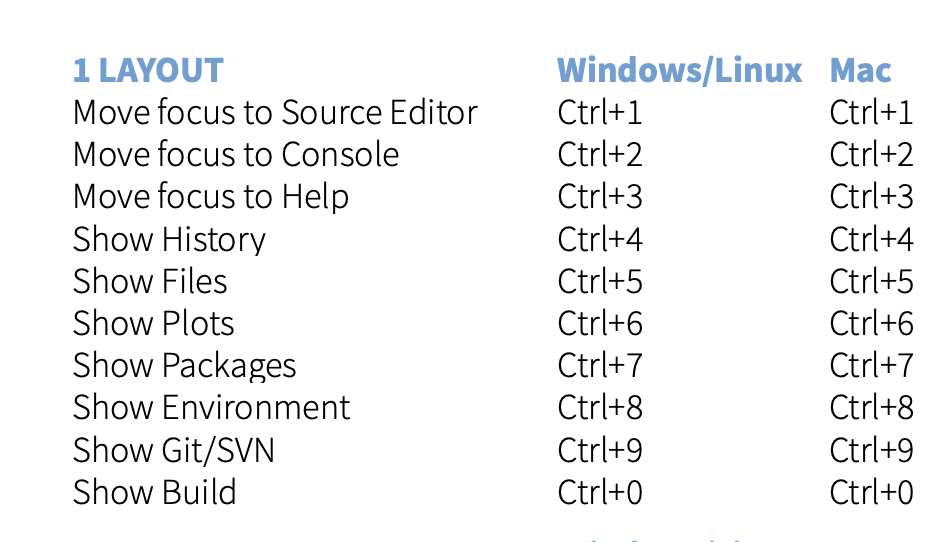 --- 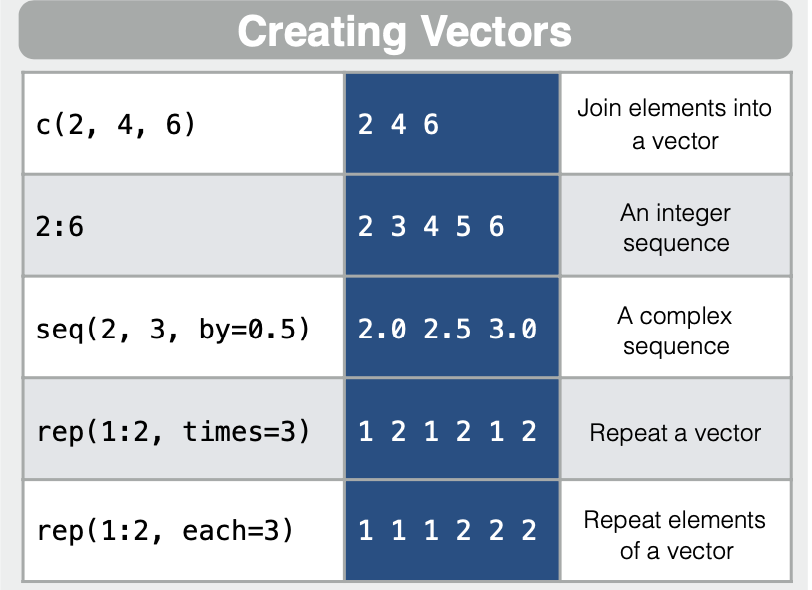 --- # Vettori ```r vec <- seq(1,10) str(vec) ``` ``` ## int [1:10] 1 2 3 4 5 6 7 8 9 10 ``` -- ```r length(vec) ``` ``` ## [1] 10 ``` ---  ---  --- # Data frame ```r df <- data.frame(x = 1:3, y = c('a', 'b', 'c')) df ``` ``` ## x y ## 1 1 a ## 2 2 b ## 3 3 c ``` -- ```r str(df) ``` ``` ## 'data.frame': 3 obs. of 2 variables: ## $ x: int 1 2 3 ## $ y: chr "a" "b" "c" ``` --- <img src="img/base3.png" width="50%" /> --- # Esercizio 1 * Creare un Data.frame di nome `dati` contenente 3 variabili + **Nome:** Alice, Francesco, Giovanna + **Età:** 4, 13, 29 + **Altezza:** 110, 156, 168 * calcolare la media della variabile **Altezza** --- # Soluzione 1 ```r dati <- data.frame(Nome = c("Alice", "Francesco", "Giovanna"), Età = c(4,13,29), Altezza = c(110,156,168)) mean(dati$Altezza) ``` ``` ## [1] 144.6667 ``` --- # Selezionare elementi da data.frame ```r #prime 6 righe head(iris) ``` ``` ## Sepal.Length Sepal.Width Petal.Length Petal.Width Species ## 1 5.1 3.5 1.4 0.2 setosa ## 2 4.9 3.0 1.4 0.2 setosa ## 3 4.7 3.2 1.3 0.2 setosa ## 4 4.6 3.1 1.5 0.2 setosa ## 5 5.0 3.6 1.4 0.2 setosa ## 6 5.4 3.9 1.7 0.4 setosa ``` ```r #nomi colonne (variabili) *colnames(iris) ``` ``` ## [1] "Sepal.Length" "Sepal.Width" "Petal.Length" "Petal.Width" "Species" ``` -- ```r # seleziona elemento in 1,1 iris[1,1] ``` ``` ## [1] 5.1 ``` ```r iris$Species[1:2] ``` ``` ## [1] setosa setosa ## Levels: setosa versicolor virginica ``` --- # cartella di lavoro ```r getwd() ``` ``` ## [1] "/Users/nicolabarban/Dropbox/Teaching/2021/labSOCIODEMO/lecture2" ``` ```r dir<-getwd() ``` -- ```r # cambiare cartella di lavoro setwd("~/Downloads") # riporto alla cartella originale setwd(dir) ``` --- # caricare library ```r #install.packages("dplyr") #Download and install from CRAN. library(dplyr) #Load the package into the session, making all its functions available to use. data(iris) #Load a build-in dataset into the environment. ``` --- # Esercizio 2 * installare library `gapminder` * caricare dataset `gapminder` * Selezionare le osservazioni relative al paese "Italy" * Quante osservazioni ci sono per l'Italia in questo dataset? --- # Soluzione 2 ```r #install.packages(‘gapminder’) library(gapminder) dim(gapminder[gapminder$country=="Italy",])[1] ``` ``` ## [1] 12 ``` --- # Soluzione 2 ```r subsample<-subset(gapminder,country=="Italy") nrow(subsample) ``` ``` ## [1] 12 ``` --- # Usare le funzioni. Modello di regressione Lineare ```r mod1<-lm(lifeExp ~ gdpPercap, data=gapminder) summary(mod1) ``` ``` ## ## Call: ## lm(formula = lifeExp ~ gdpPercap, data = gapminder) ## ## Residuals: ## Min 1Q Median 3Q Max ## -82.754 -7.758 2.176 8.225 18.426 ## ## Coefficients: ## Estimate Std. Error t value Pr(>|t|) ## (Intercept) 5.396e+01 3.150e-01 171.29 <2e-16 *** ## gdpPercap 7.649e-04 2.579e-05 29.66 <2e-16 *** ## --- ## Signif. codes: 0 '***' 0.001 '**' 0.01 '*' 0.05 '.' 0.1 ' ' 1 ## ## Residual standard error: 10.49 on 1702 degrees of freedom ## Multiple R-squared: 0.3407, Adjusted R-squared: 0.3403 ## F-statistic: 879.6 on 1 and 1702 DF, p-value: < 2.2e-16 ``` --- # Scatterplot ```r plot(lifeExp ~ gdpPercap, data=gapminder) ``` <img src="lezione2_files/figure-html/unnamed-chunk-18-1.png" width="504" /> --- # Esercizio3 * Stima un modello lineare con: + **variabile dipendente (Y):** life expectancy + **variabile indipendente (Y):** logaritmo `gdpPercap` * Mostra i coefficienti stimati * Visualizza lo scatterplot (extra: cambia colore dei punti, cambia etichette degli assi) * Aggiungi la retta stimata al grafico --- # Soluzione 3 ```r *mod.log <- lm(lifeExp ~ log(gdpPercap), data=gapminder) coef <- mod.log$coefficients coef ``` ``` ## (Intercept) log(gdpPercap) ## -9.100889 8.405085 ``` --- ```r plot(lifeExp ~ log(gdpPercap), data=gapminder, col="red", ylab="Aspettativa di vita", xlab="logaritimo naturale PIL per capita") abline(a=coef[1],b=coef[2], col="blue") ``` <img src="lezione2_files/figure-html/unnamed-chunk-20-1.png" width="504" /> --- # caricamento dataset ```r # importing data US_income<-read.csv("US_income.csv") # listing objects ls() ``` ``` ## [1] "a" "b" ## [3] "coef" "dati" ## [5] "df" "dir" ## [7] "iris" "mod.log" ## [9] "mod1" "subsample" ## [11] "US_income" "vaccini_somministrazione" ## [13] "vec" ``` ```r head(US_income) ``` ``` ## X GEOID name median_income median_income_moe population area ## 1 1 1 Alabama 43623 281 4830620 133958437749 ## 2 2 4 Arizona 50255 211 6641928 295232708152 ## 3 3 5 Arkansas 41371 247 2958208 137792577218 ## 4 4 6 California 61818 156 38421464 410516610493 ## 5 5 8 Colorado 60629 252 5278906 269580118211 ## 6 6 9 Connecticut 70331 409 3593222 12961831628 ## popdens ## 1 3.606059e-05 ## 2 2.249726e-05 ## 3 2.146856e-05 ## 4 9.359296e-05 ## 5 1.958196e-05 ## 6 2.772156e-04 ``` --- # Importa datasets Rstudio > File > Import Dataset > From text --- # salvataggio e pulizia oggetti ```r write.table(gapminder, file="gapminder.txt") ``` --- # caricamento dati da internet ```r vaccini_somministrazione <-read.csv("https://raw.githubusercontent.com/italia/covid19-opendata-vaccini/master/dati/vaccini-summary-latest.csv", header=T) # Solo su Rstudio! #View(vaccini_somministrazione) summary(vaccini_somministrazione) ``` ``` ## area dosi_somministrate dosi_consegnate ## Length:21 Min. : 9975 Min. : 9400 ## Class :character 1st Qu.: 46750 1st Qu.: 48085 ## Mode :character Median : 80064 Median :104370 ## Mean :148697 Mean :173870 ## 3rd Qu.:254976 3rd Qu.:304235 ## Max. :527377 Max. :602080 ## percentuale_somministrazione ultimo_aggiornamento codice_NUTS1 ## Min. : 63.00 Length:21 Length:21 ## 1st Qu.: 78.50 Class :character Class :character ## Median : 84.10 Mode :character Mode :character ## Mean : 84.52 ## 3rd Qu.: 88.30 ## Max. :106.10 ## codice_NUTS2 codice_regione_ISTAT nome_area ## Length:21 Min. : 1.00 Length:21 ## Class :character 1st Qu.: 5.00 Class :character ## Mode :character Median :10.00 Mode :character ## Mean :10.19 ## 3rd Qu.:15.00 ## Max. :20.00 ```