RetirementSweden
Supplementary Figures
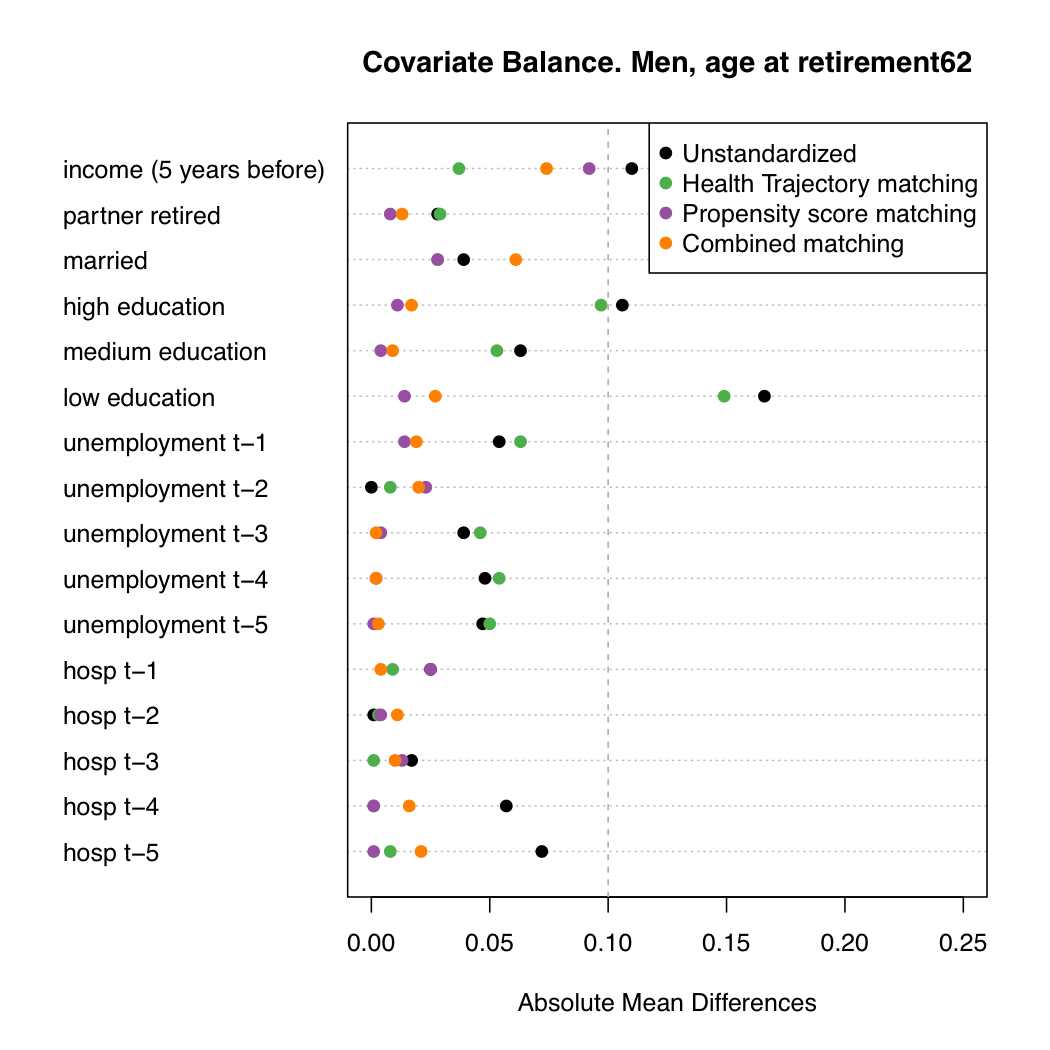
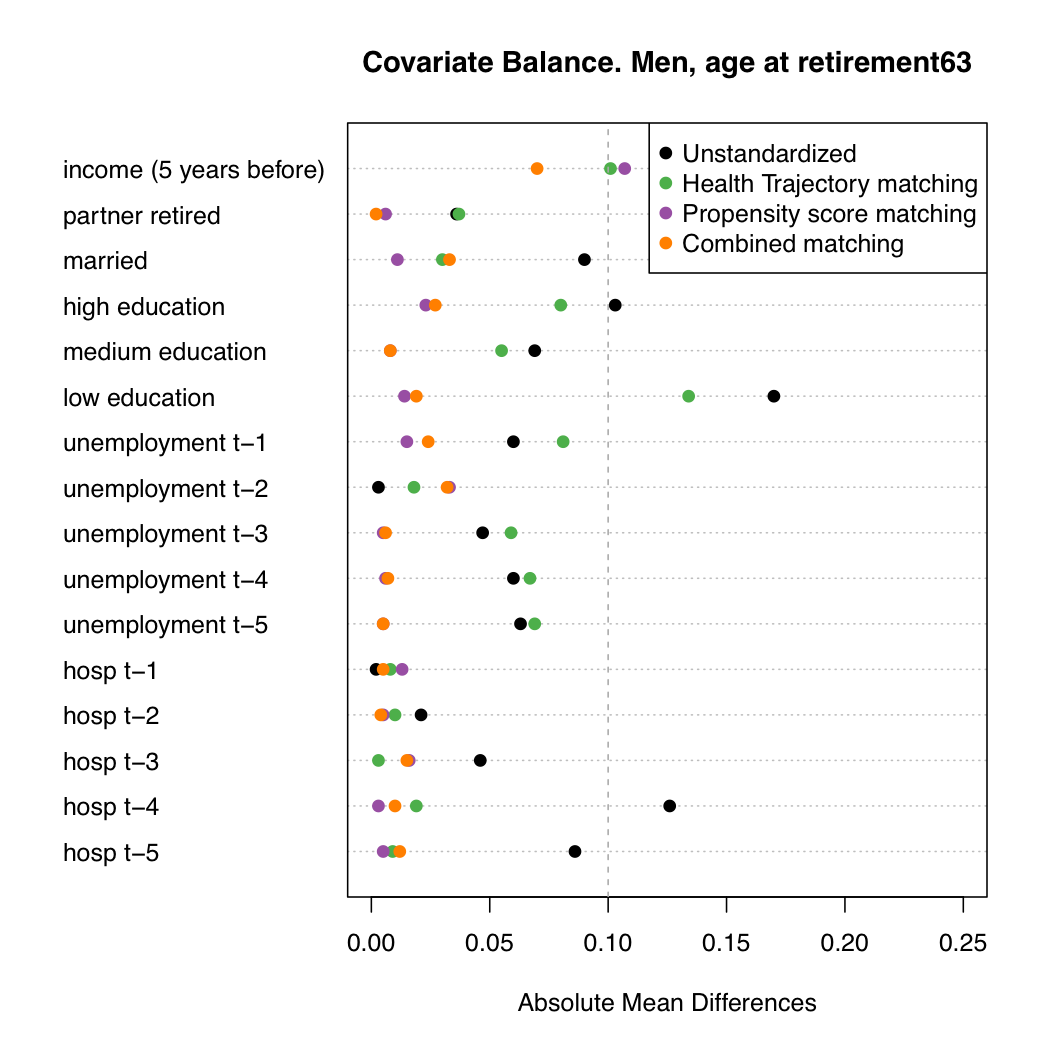
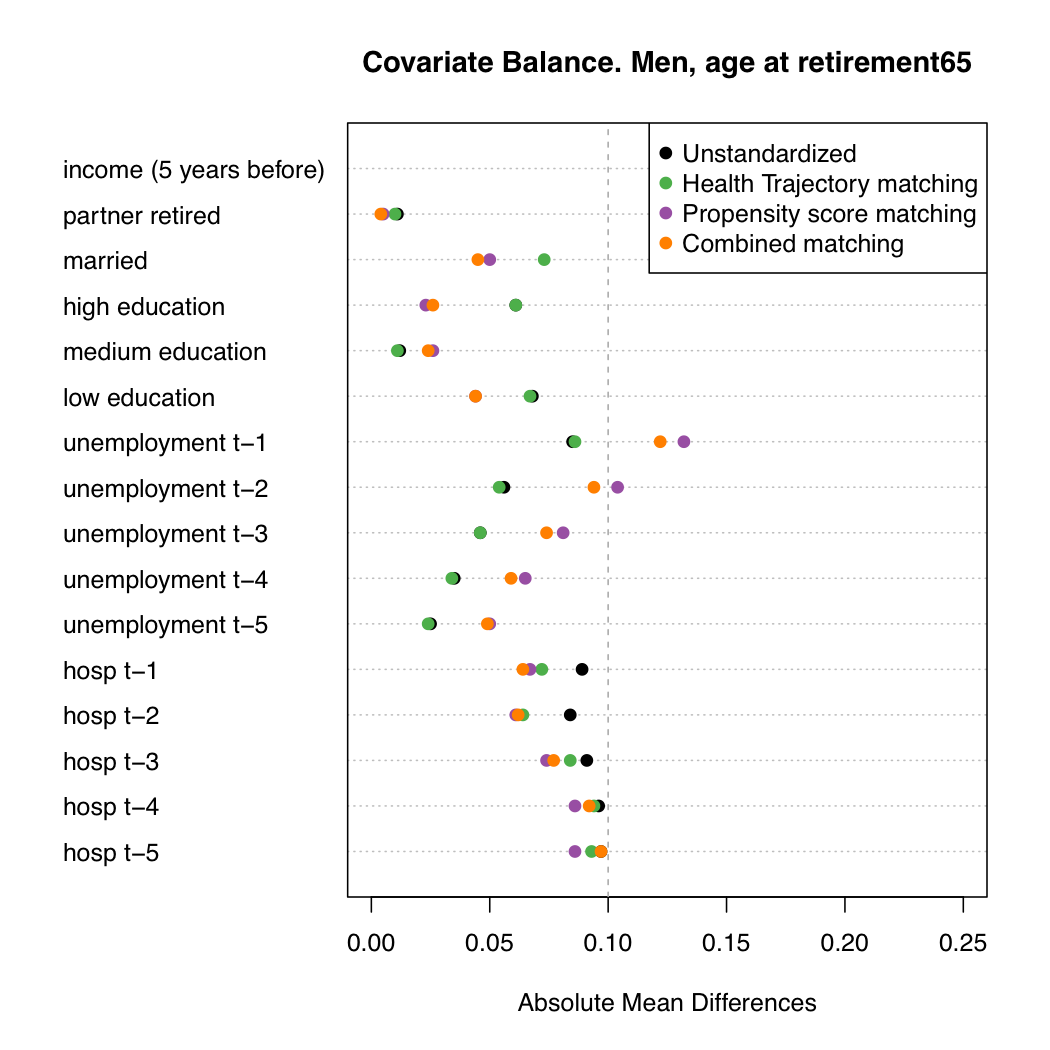
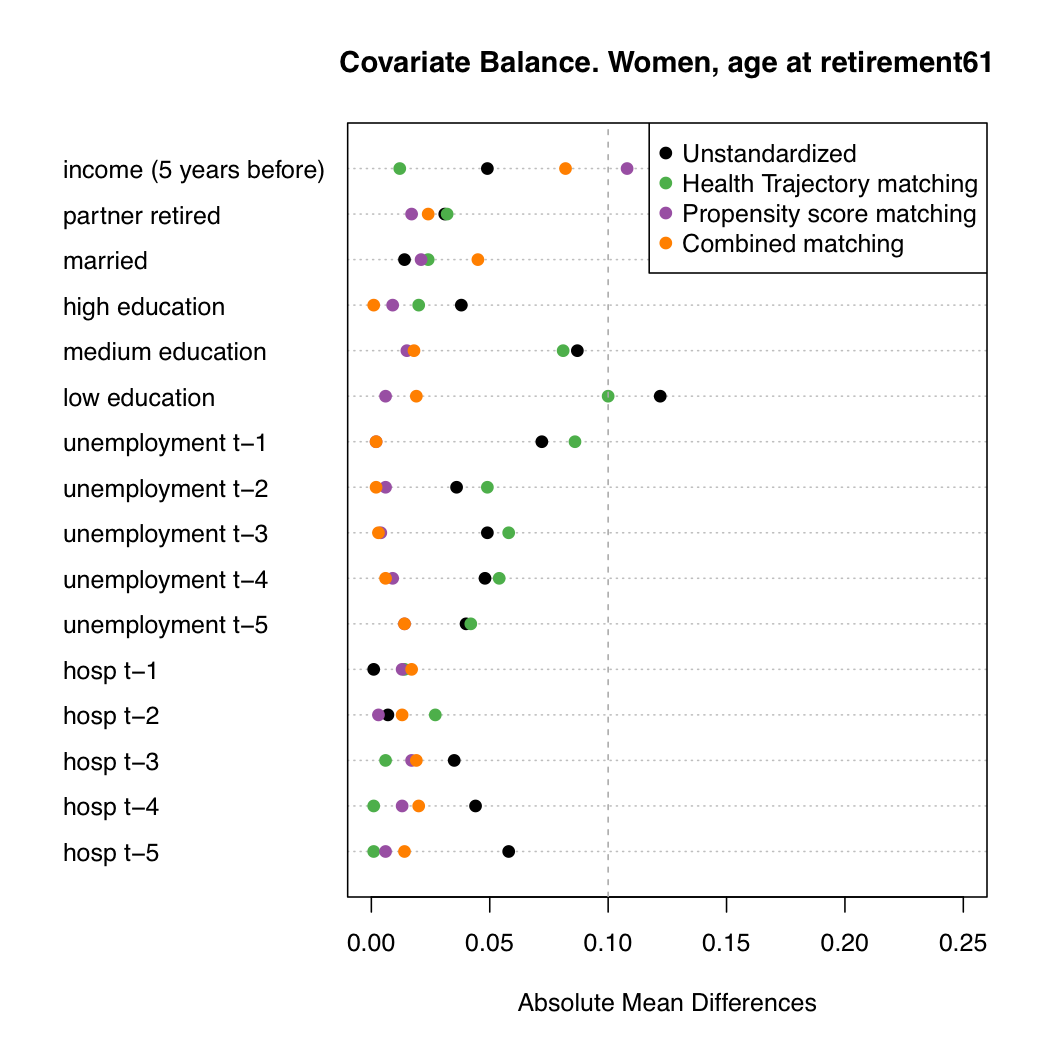
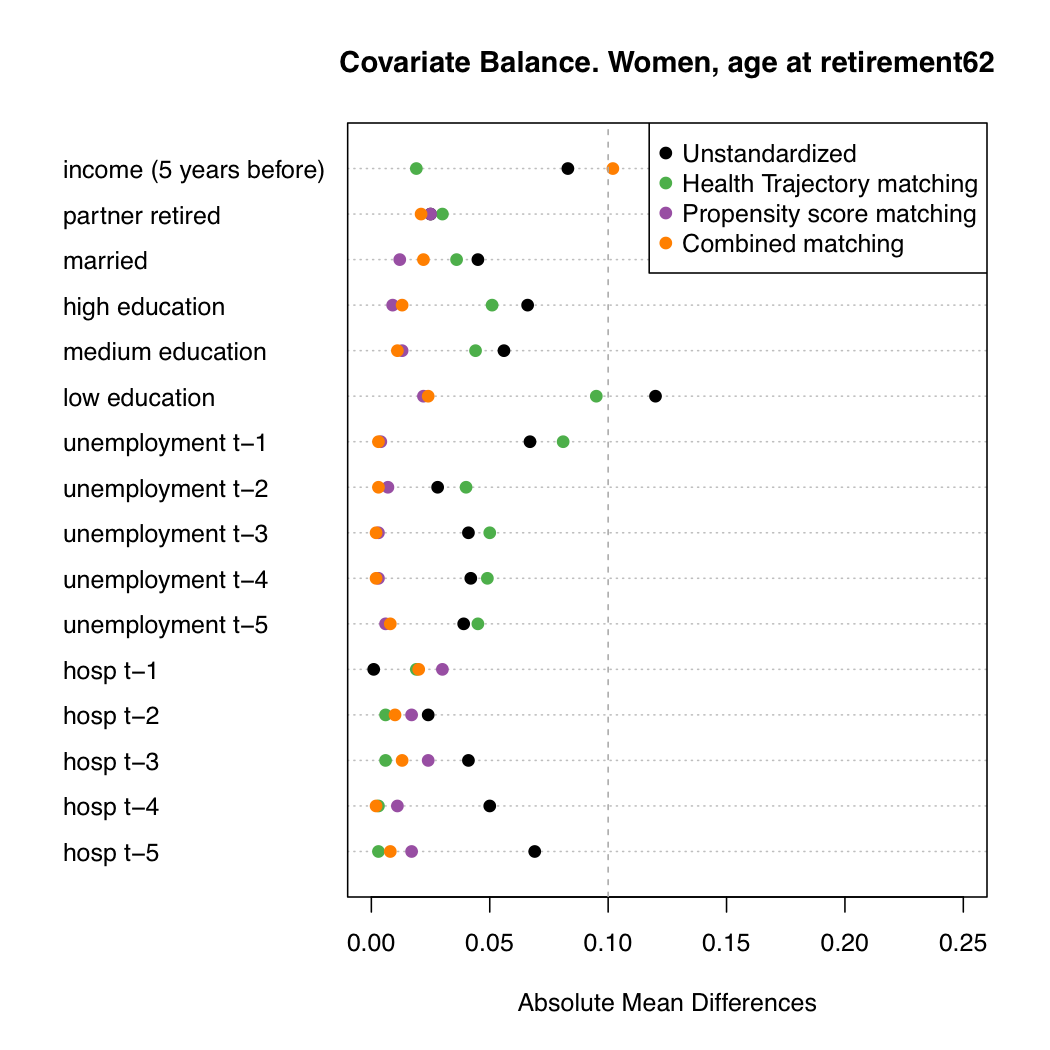
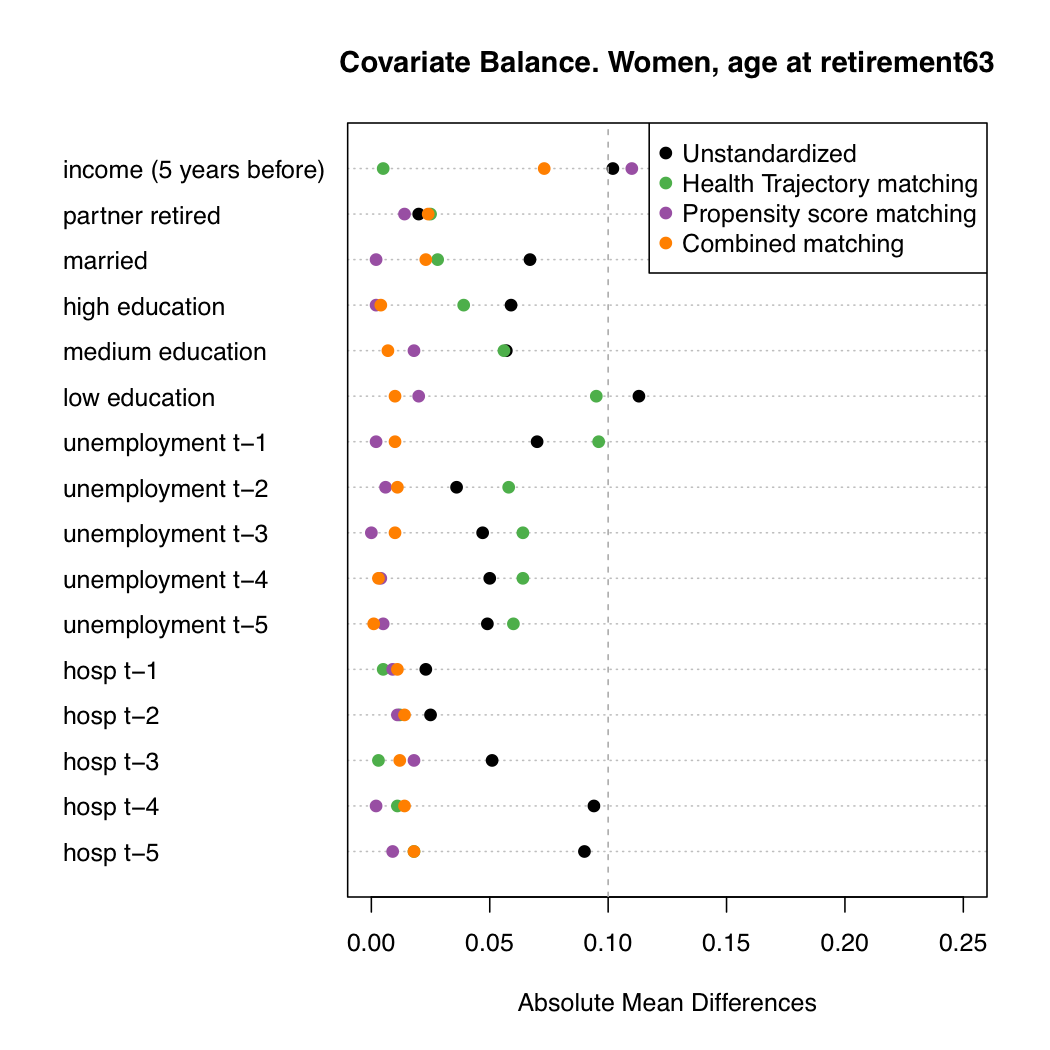
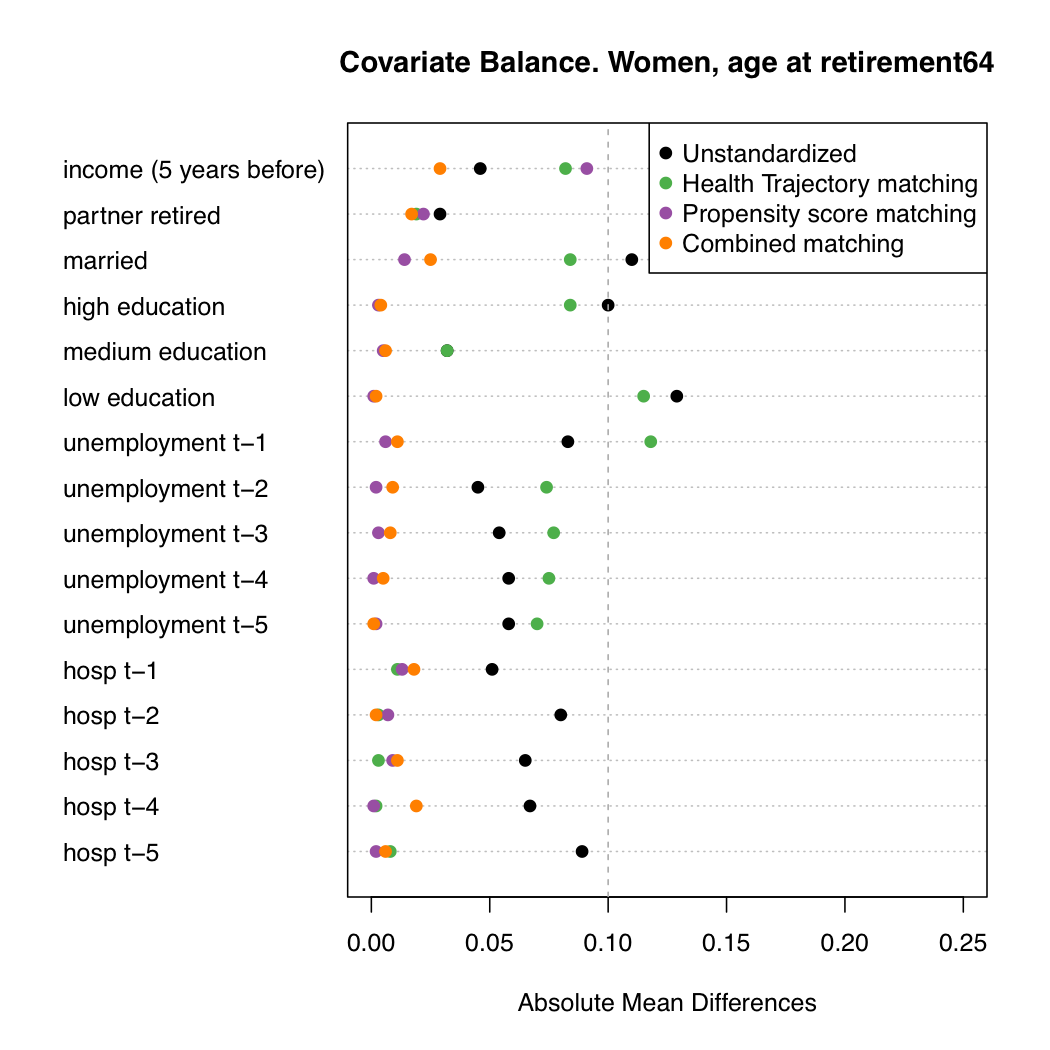
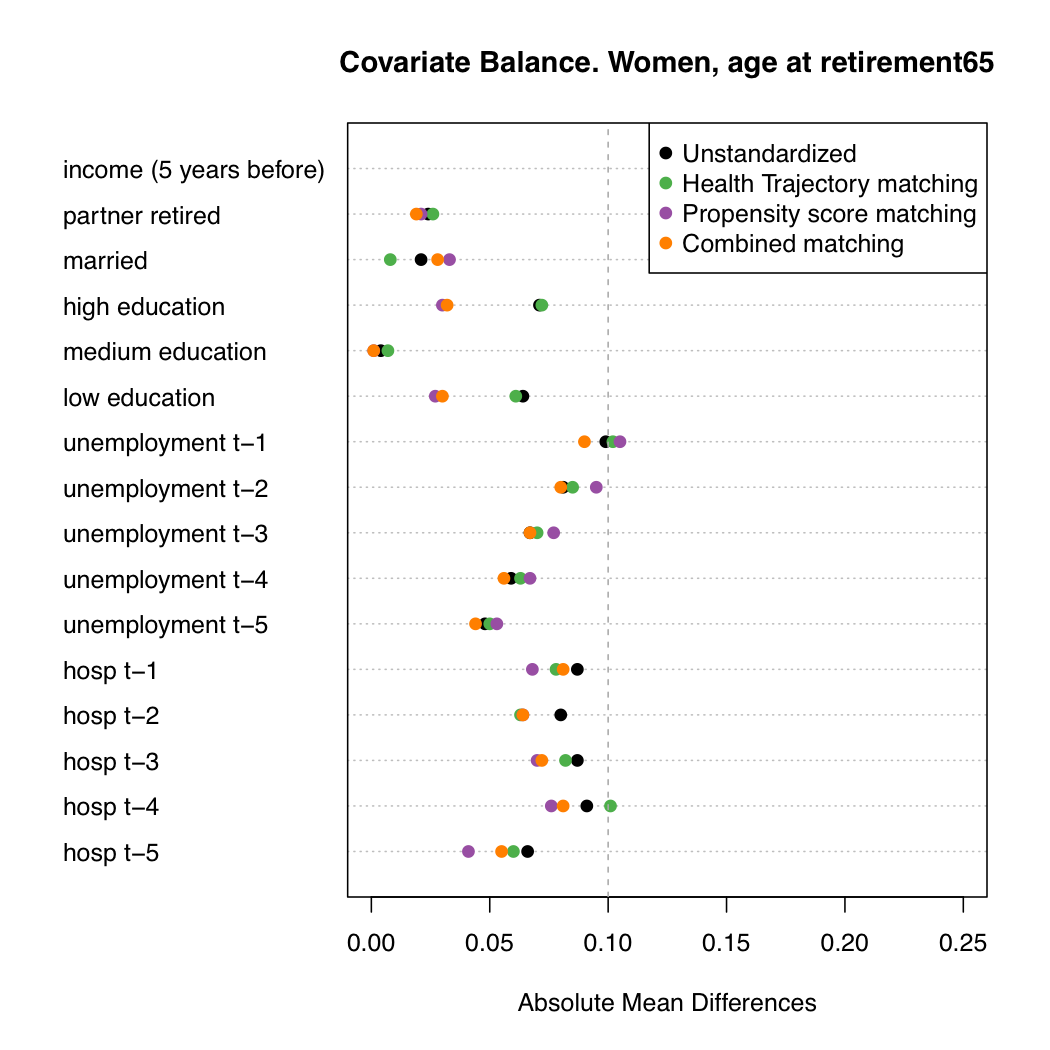
Mean differences in covariates under different matching strategies.


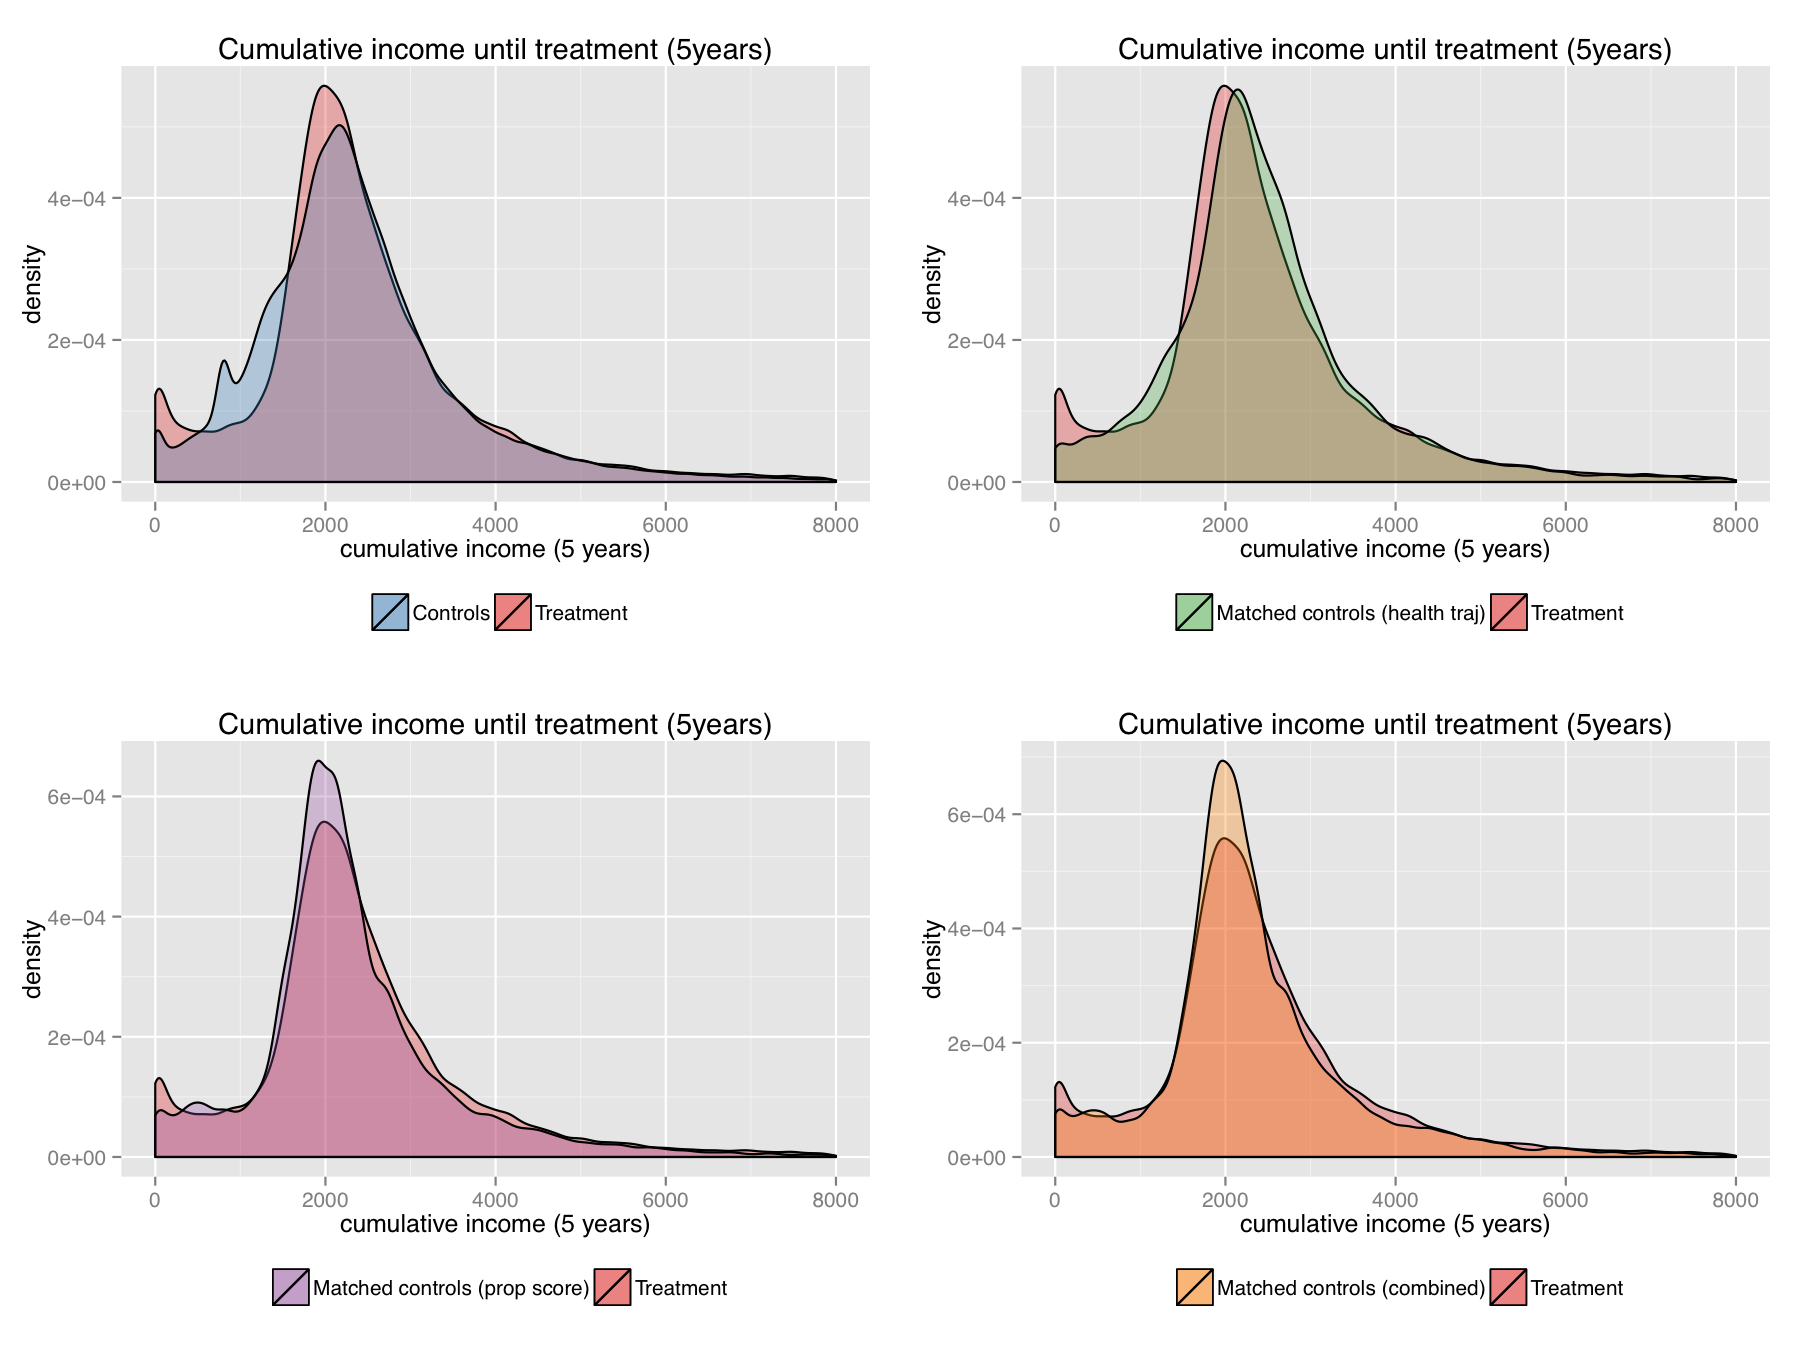
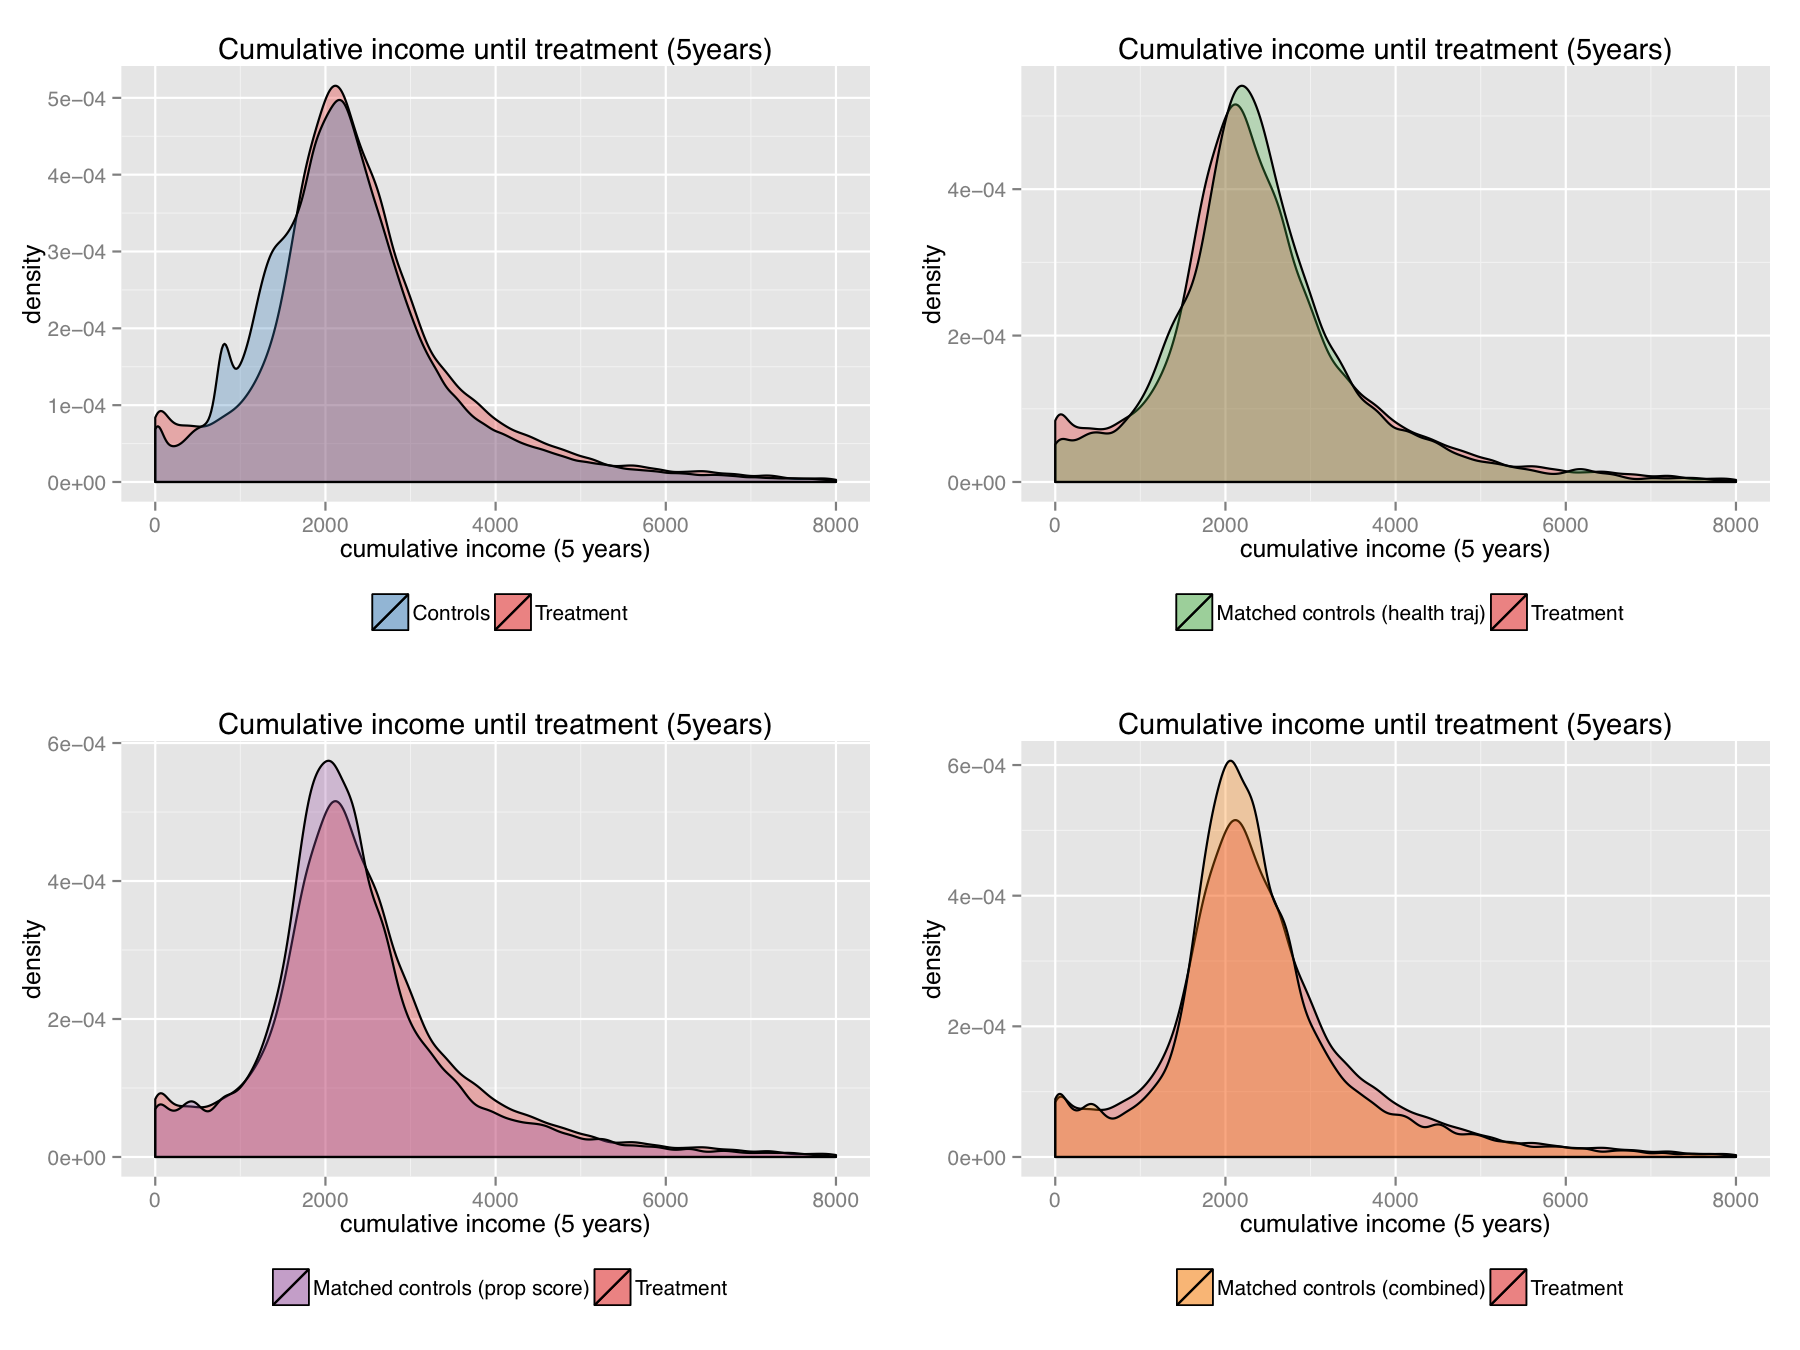
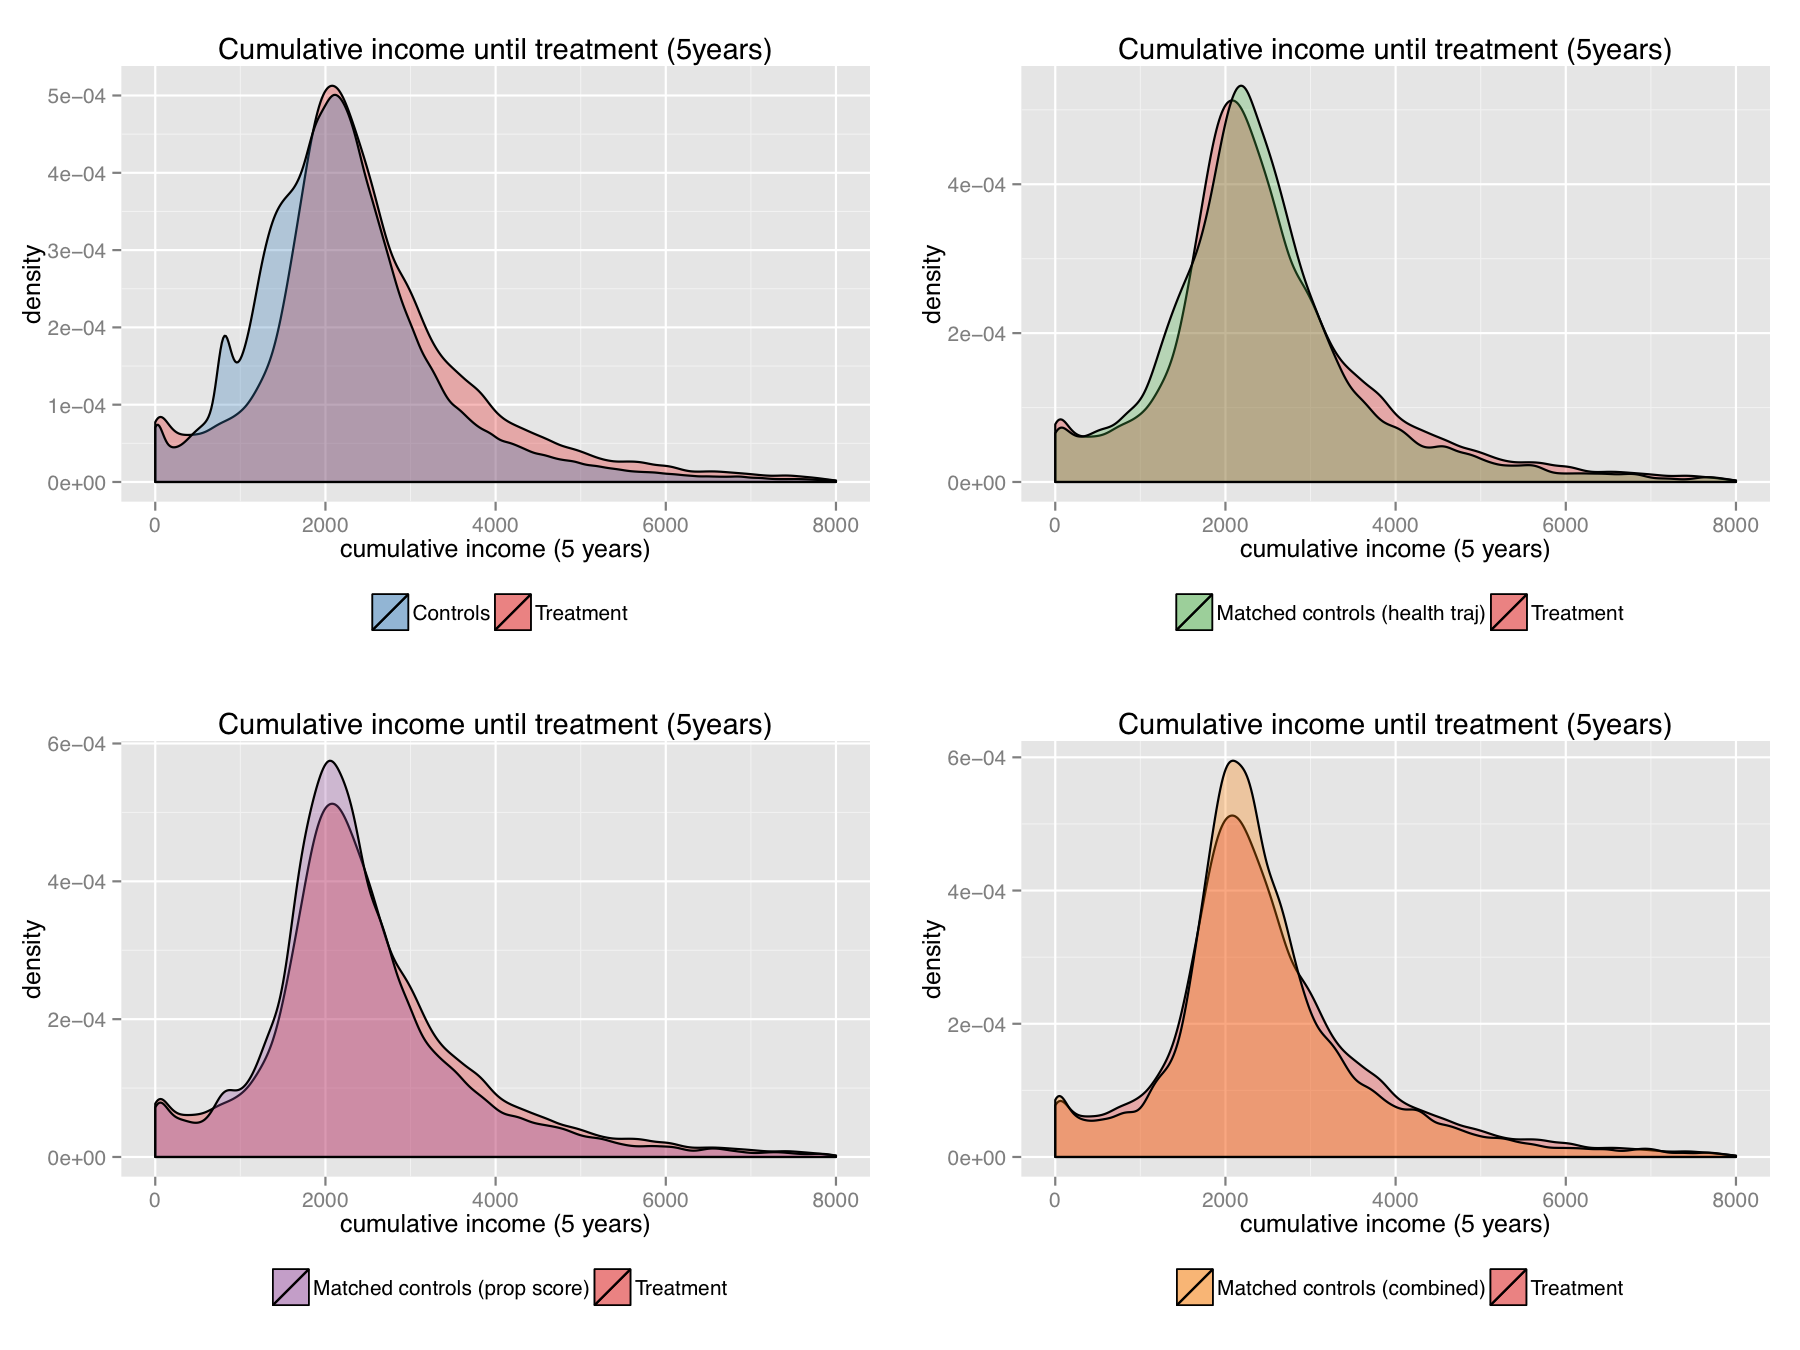
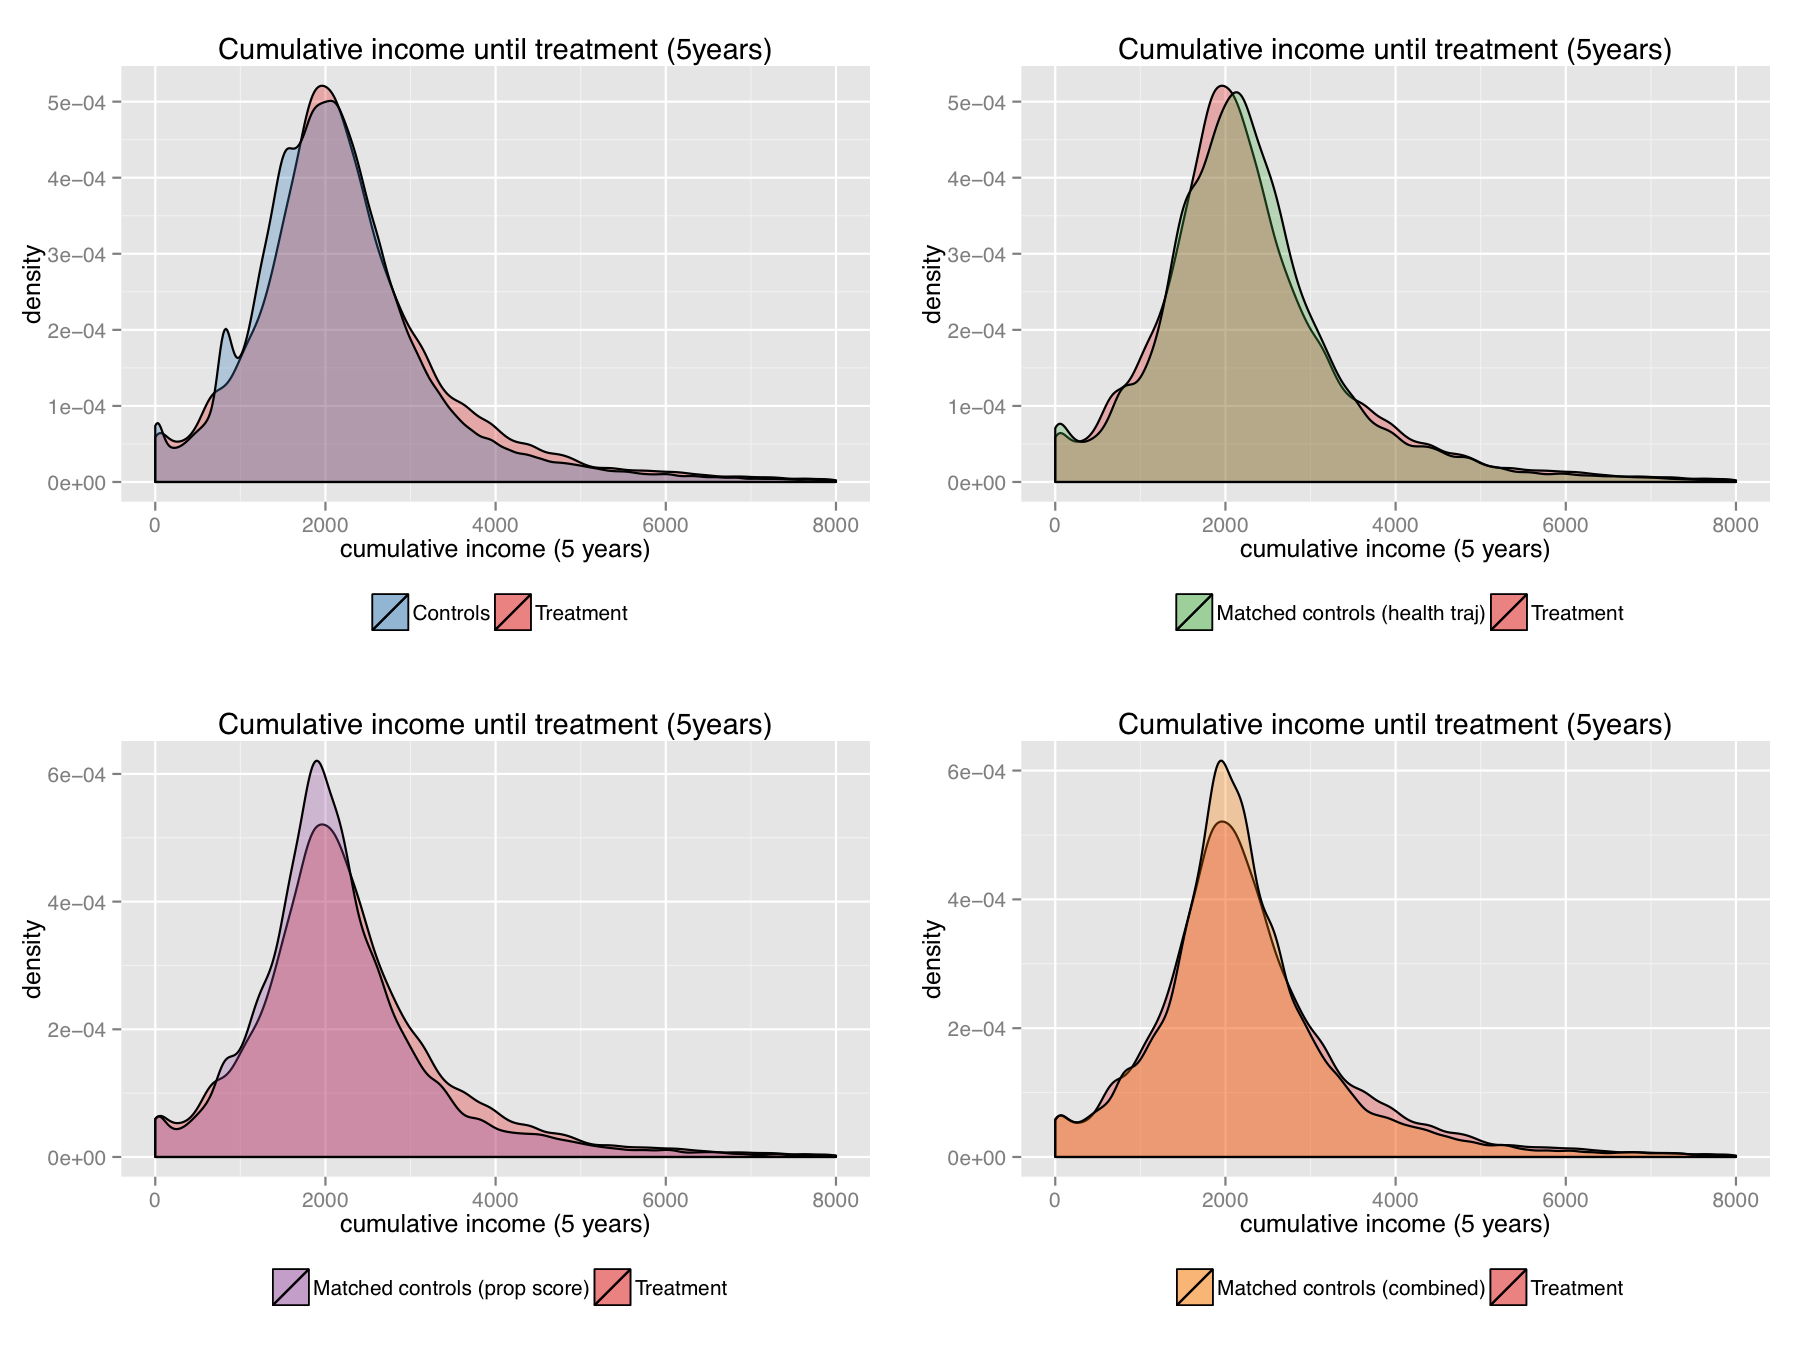
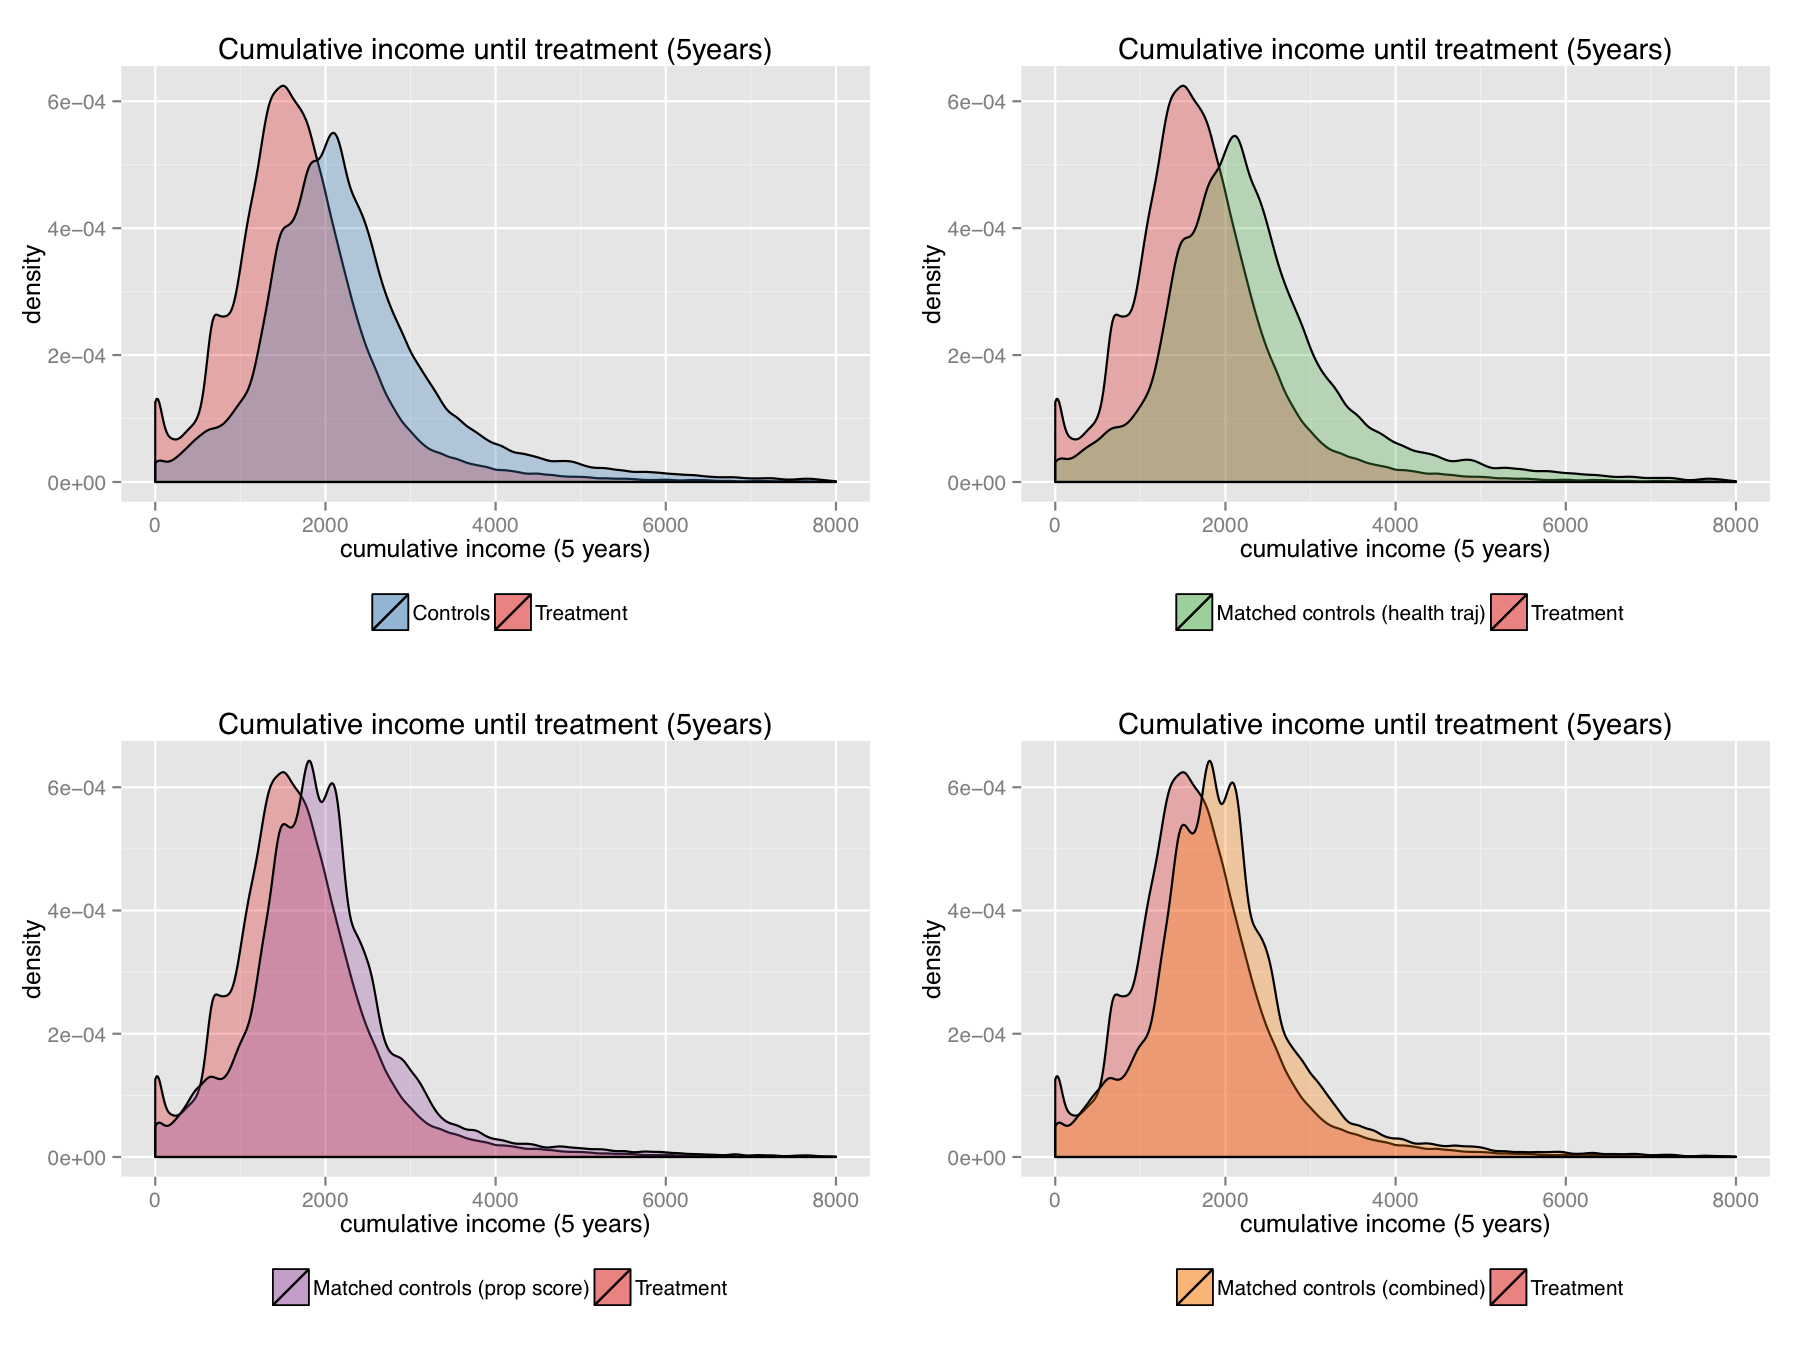
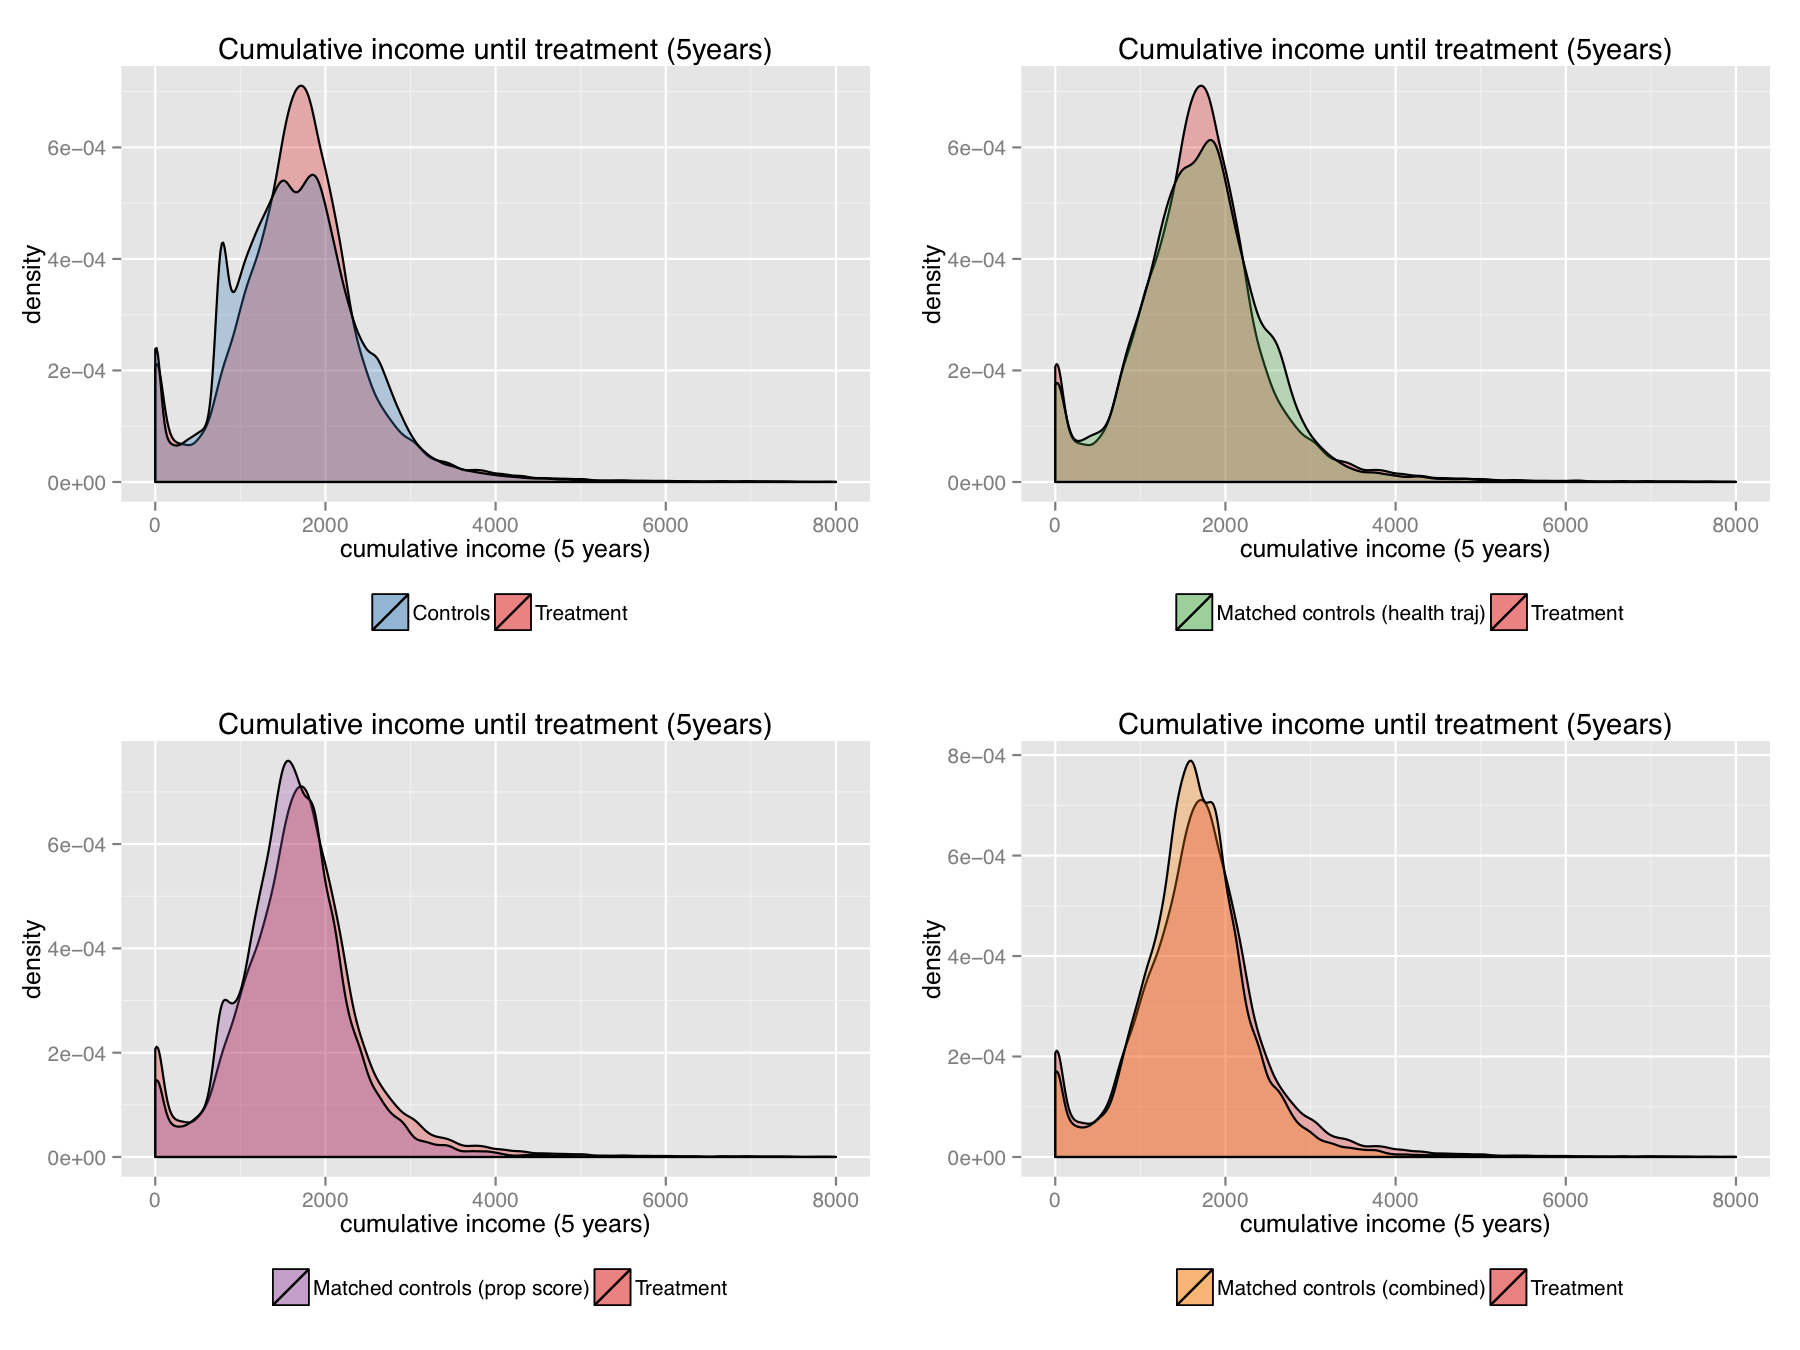
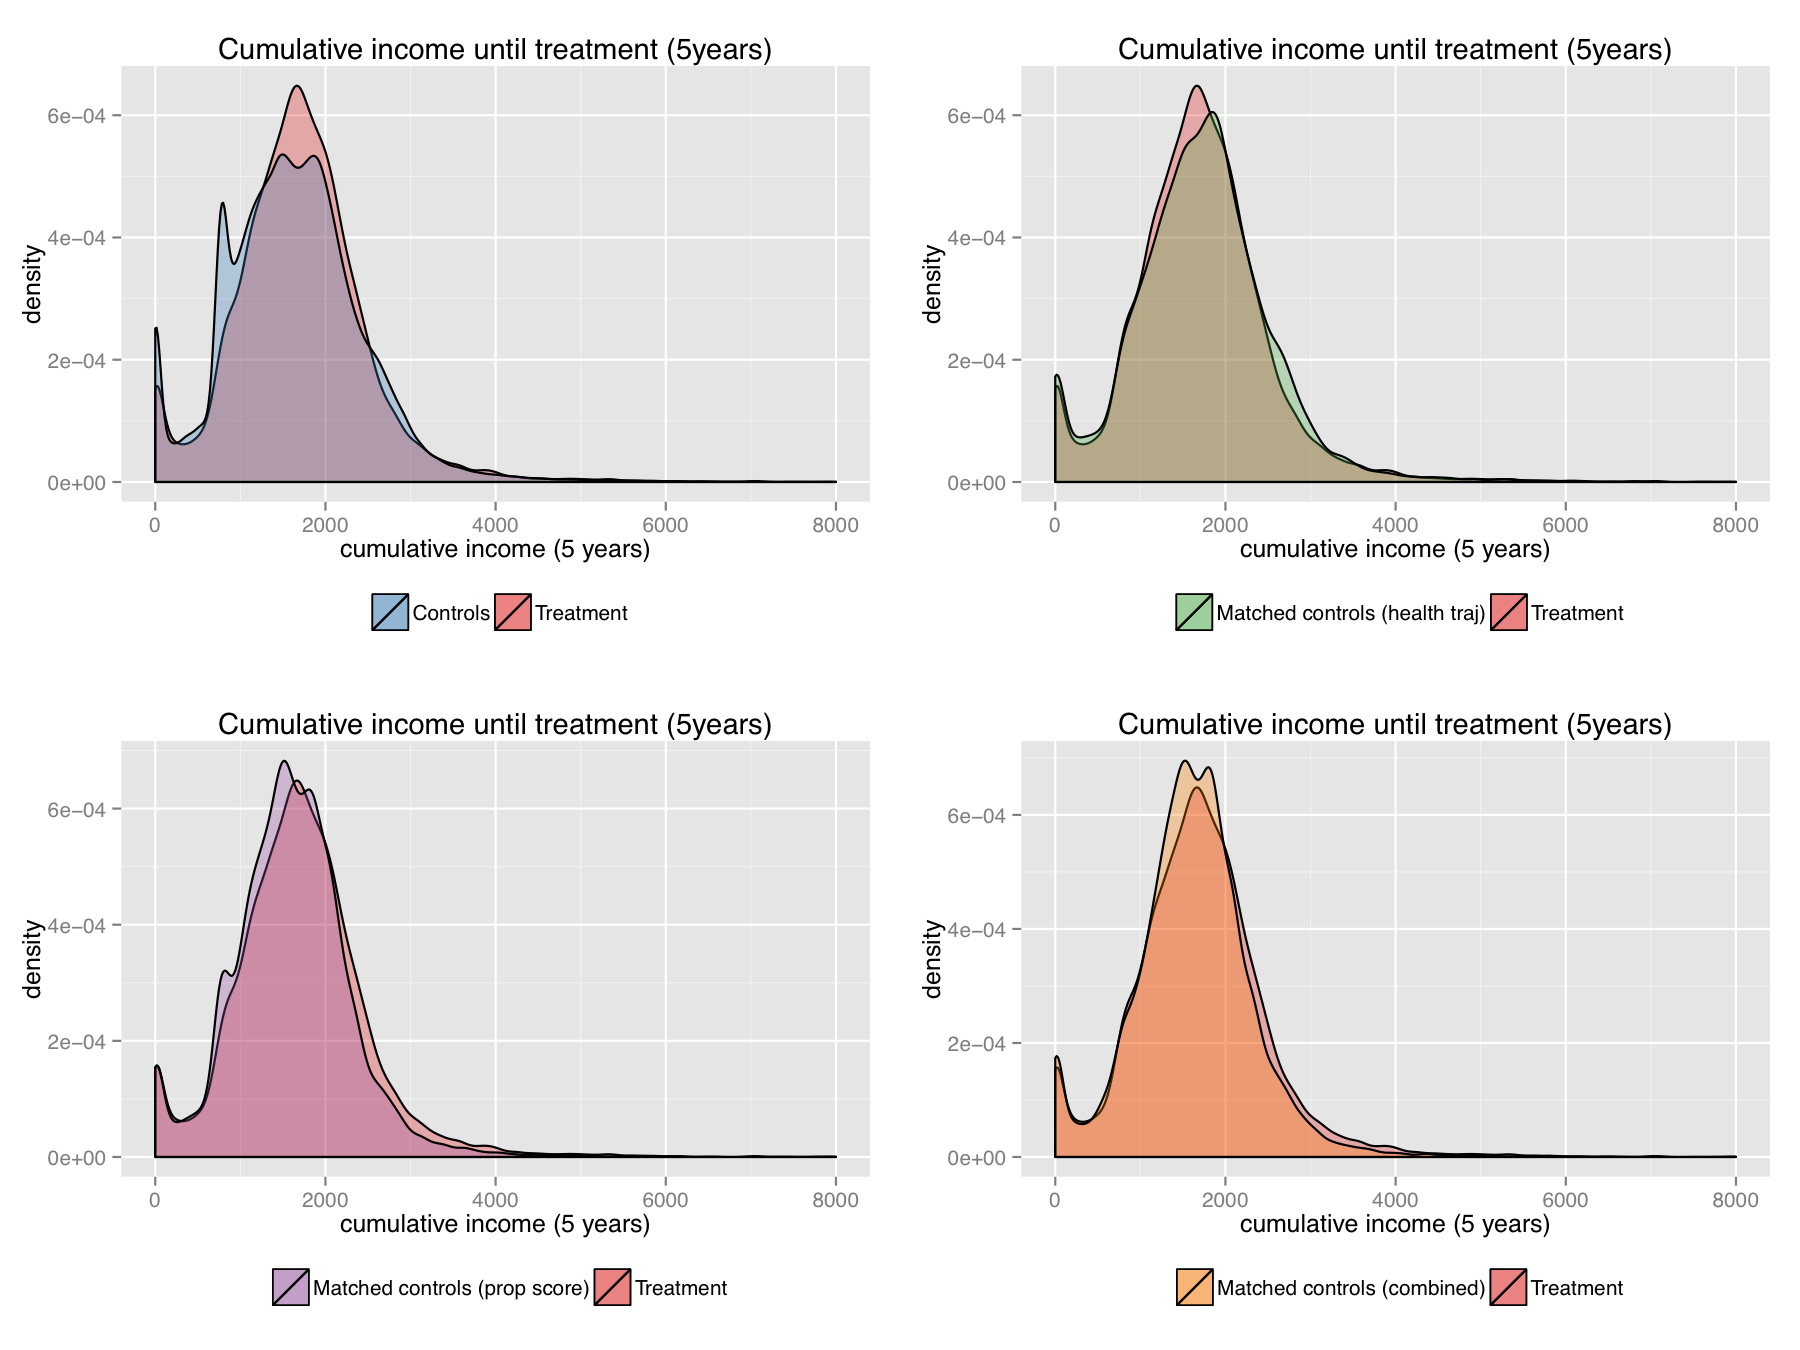
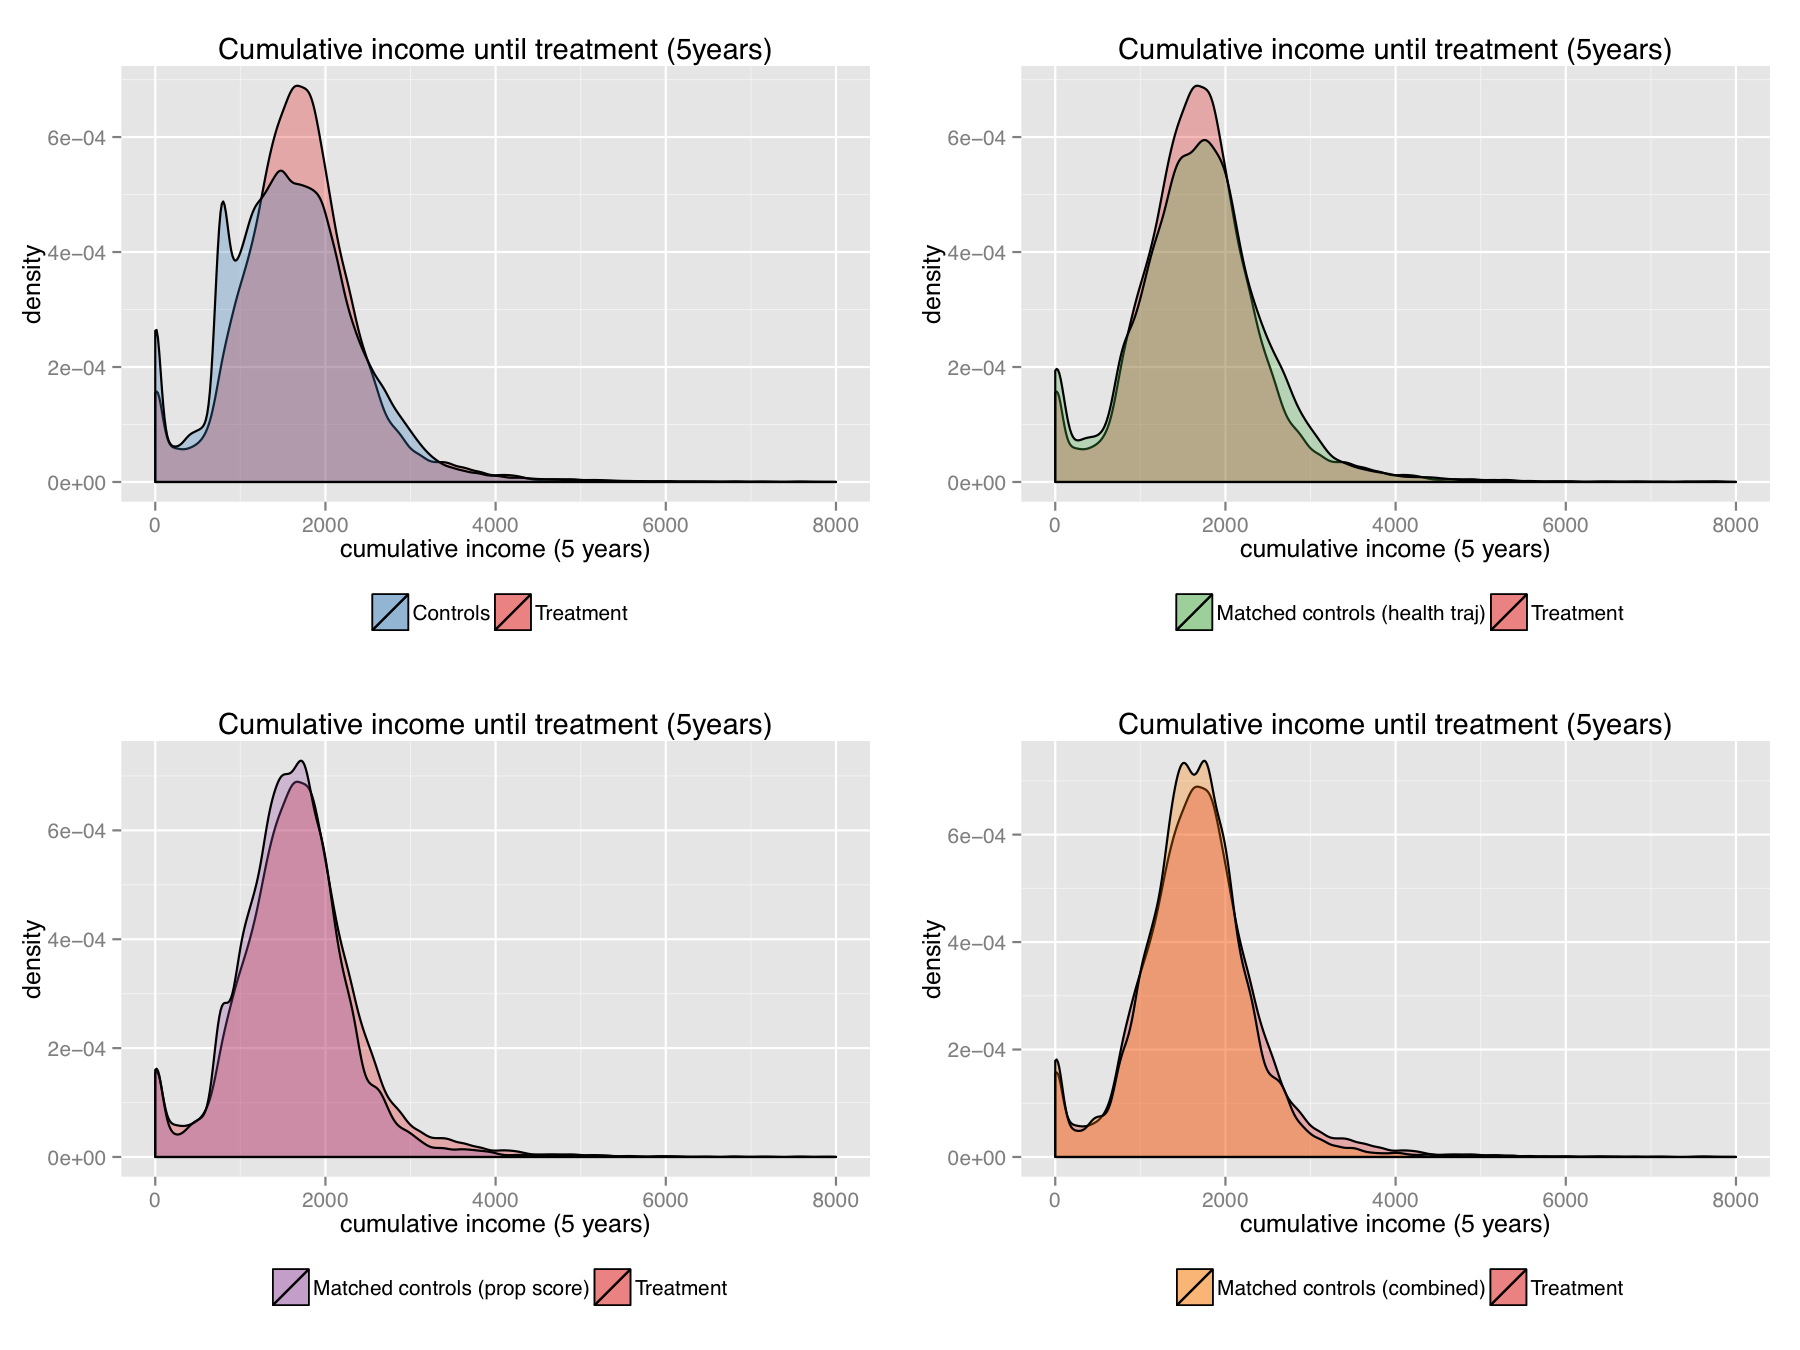
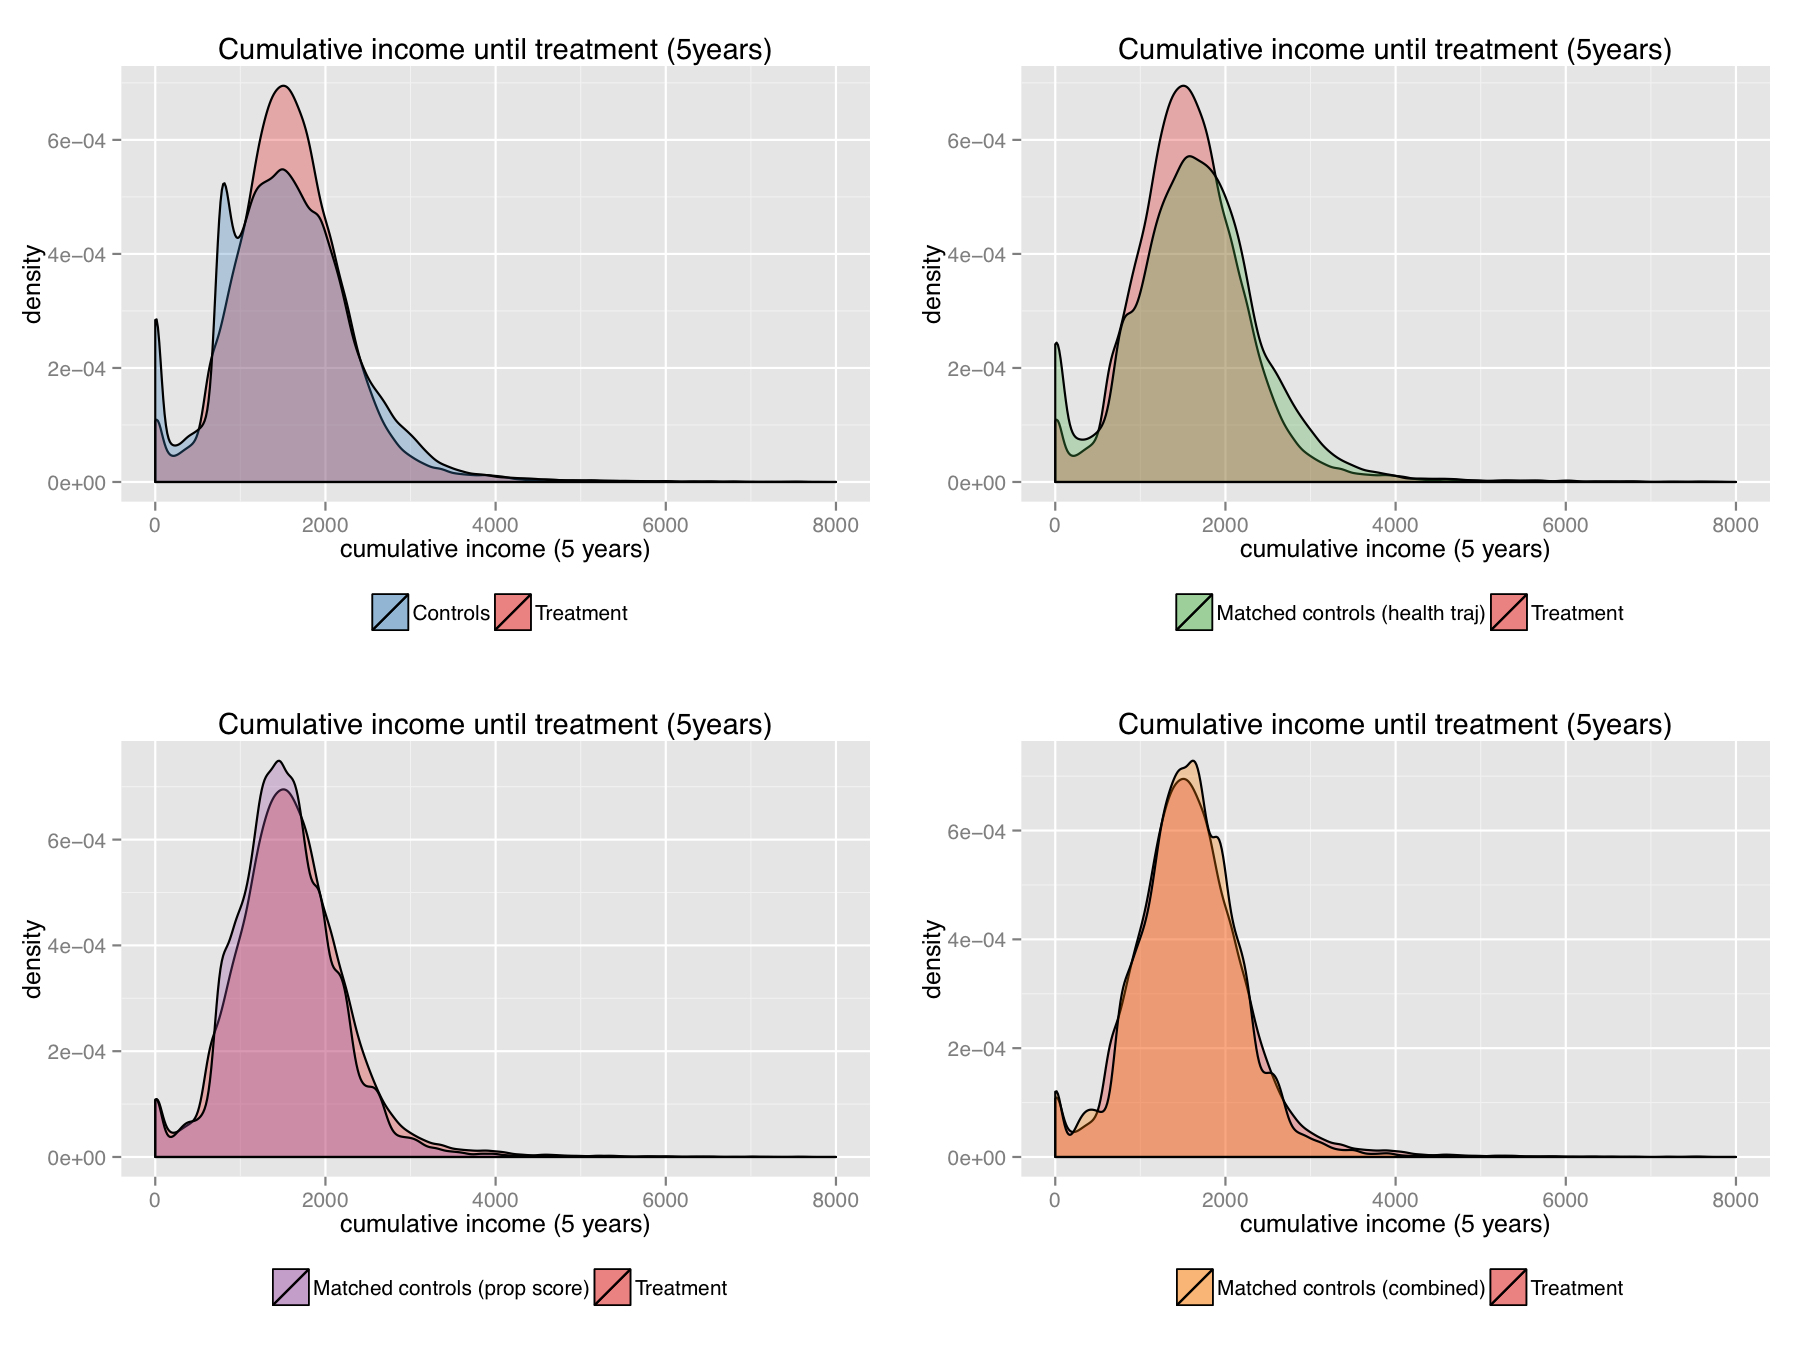
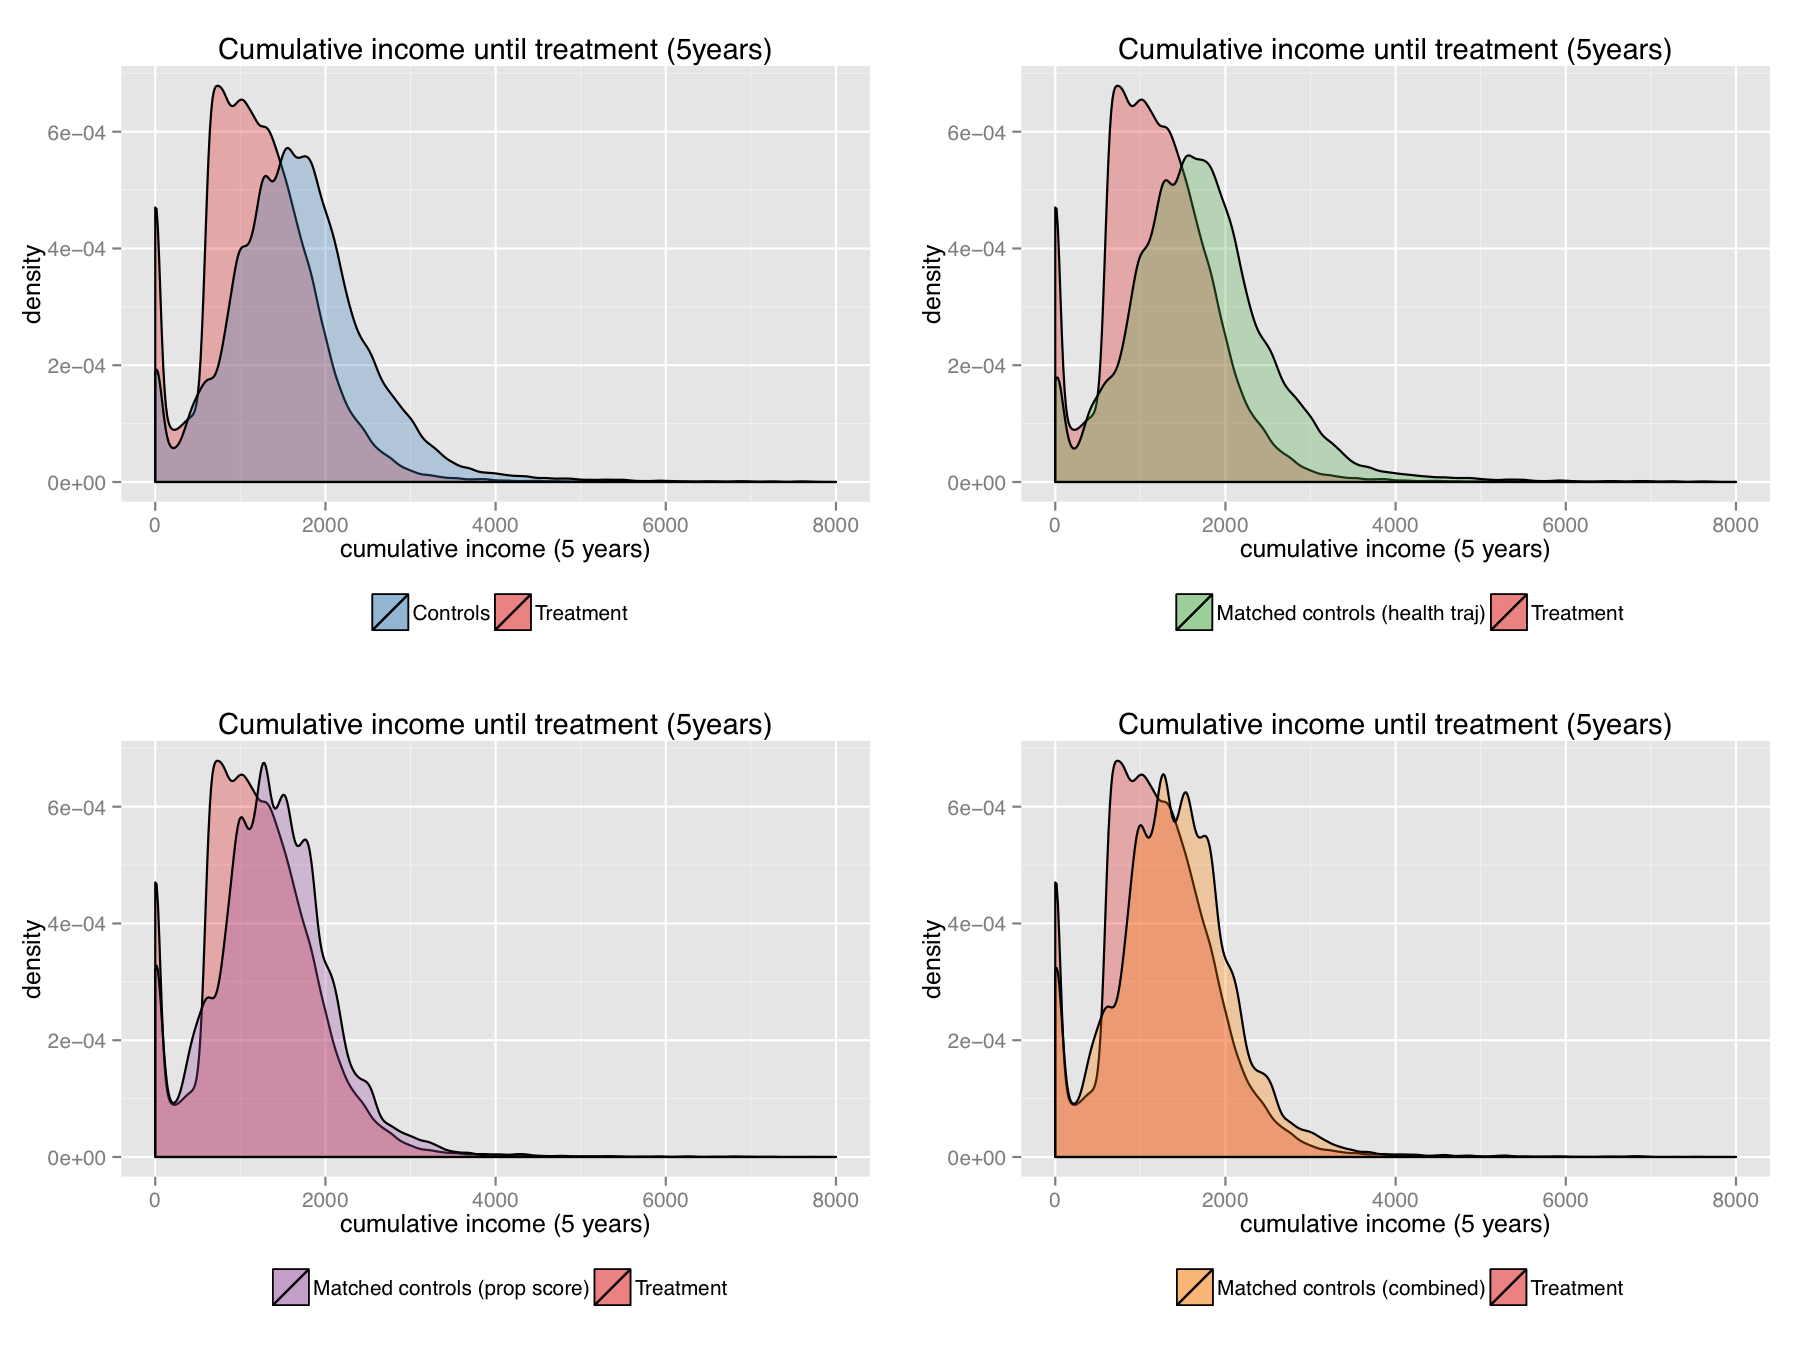
Distribution of cumulative income five years before retirement under different matching strategies.
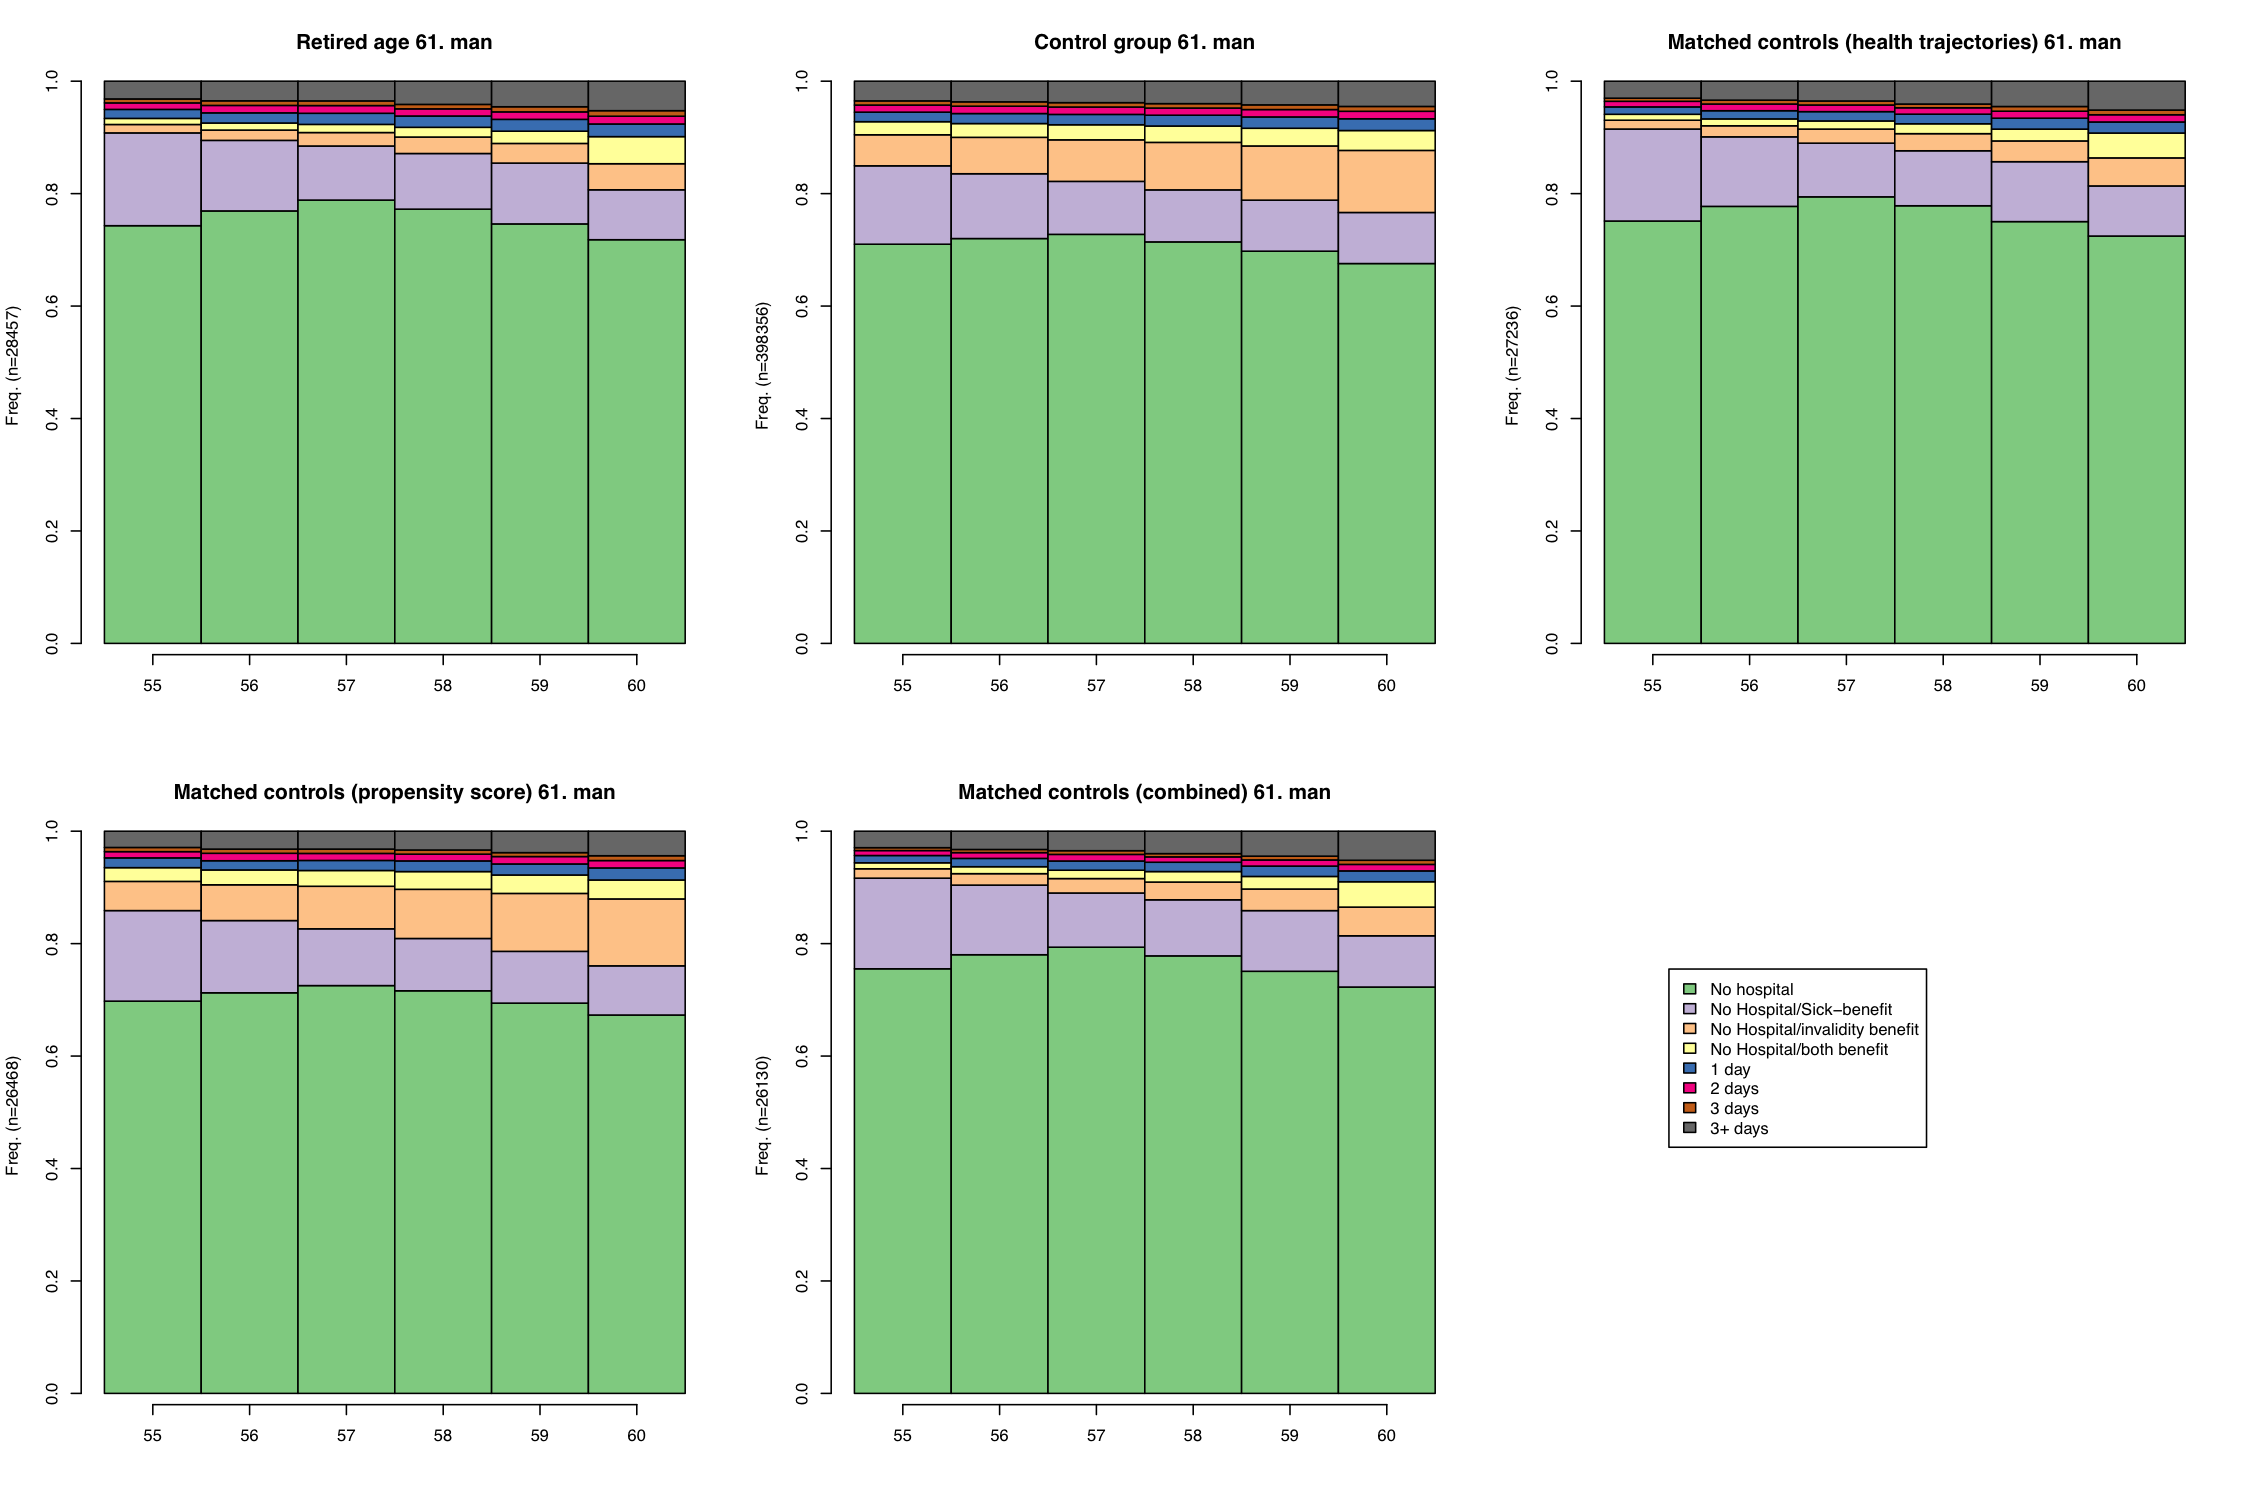
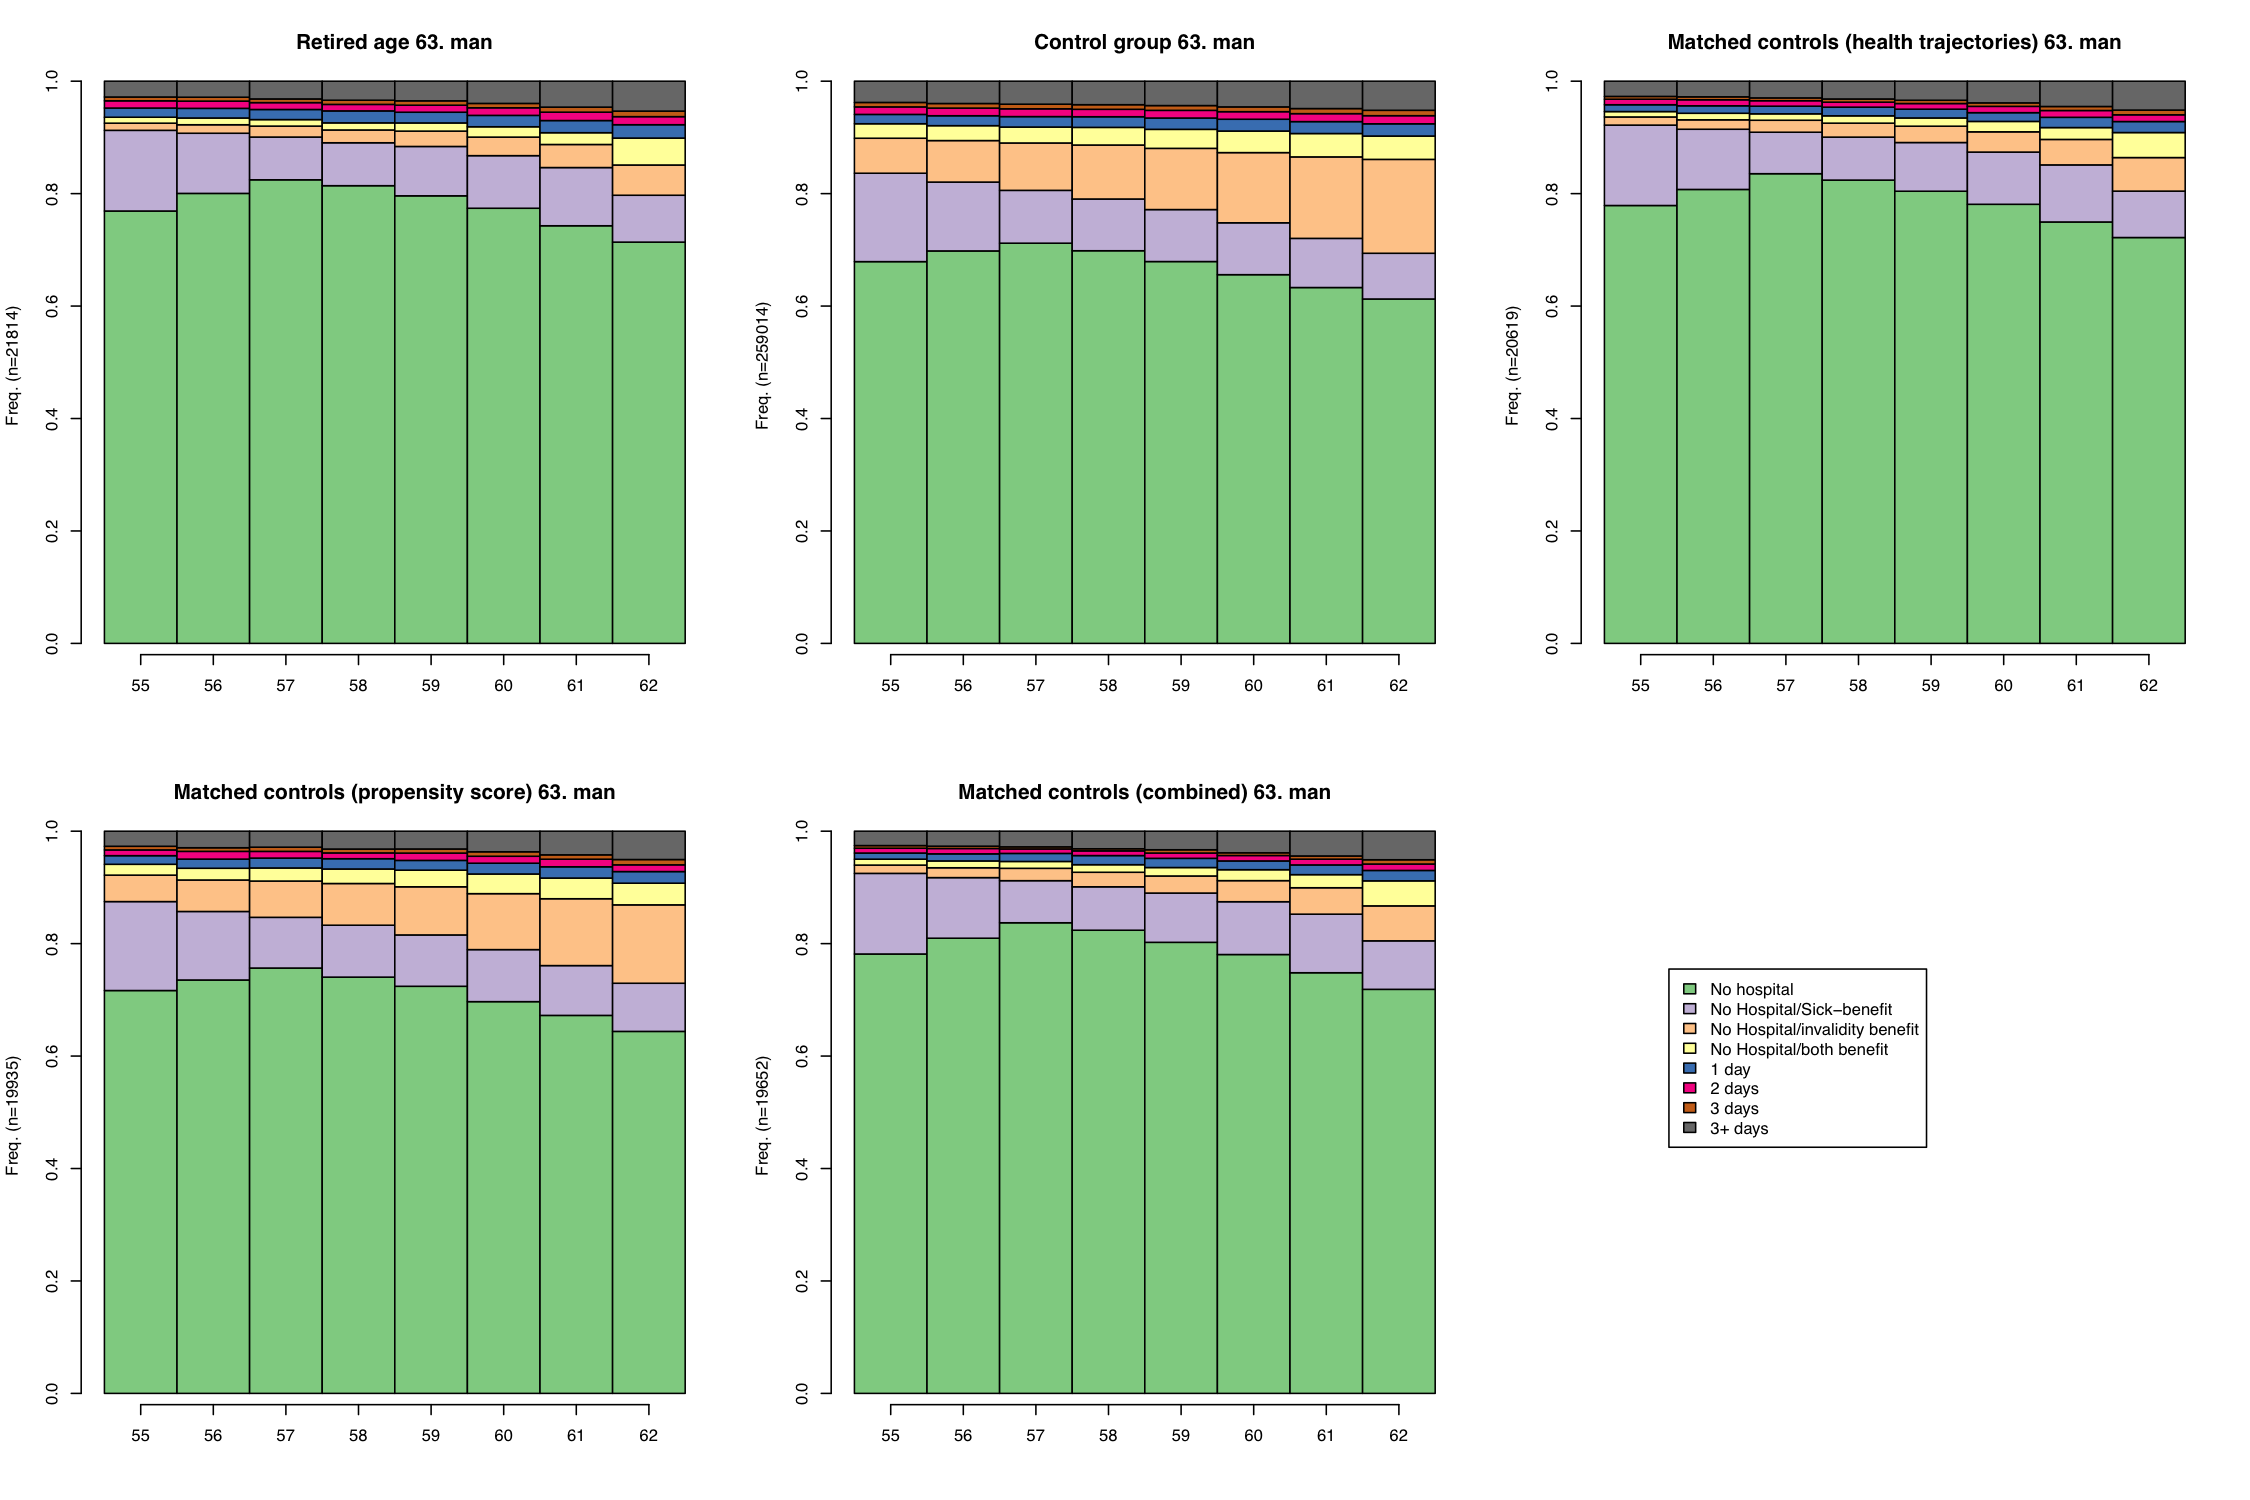
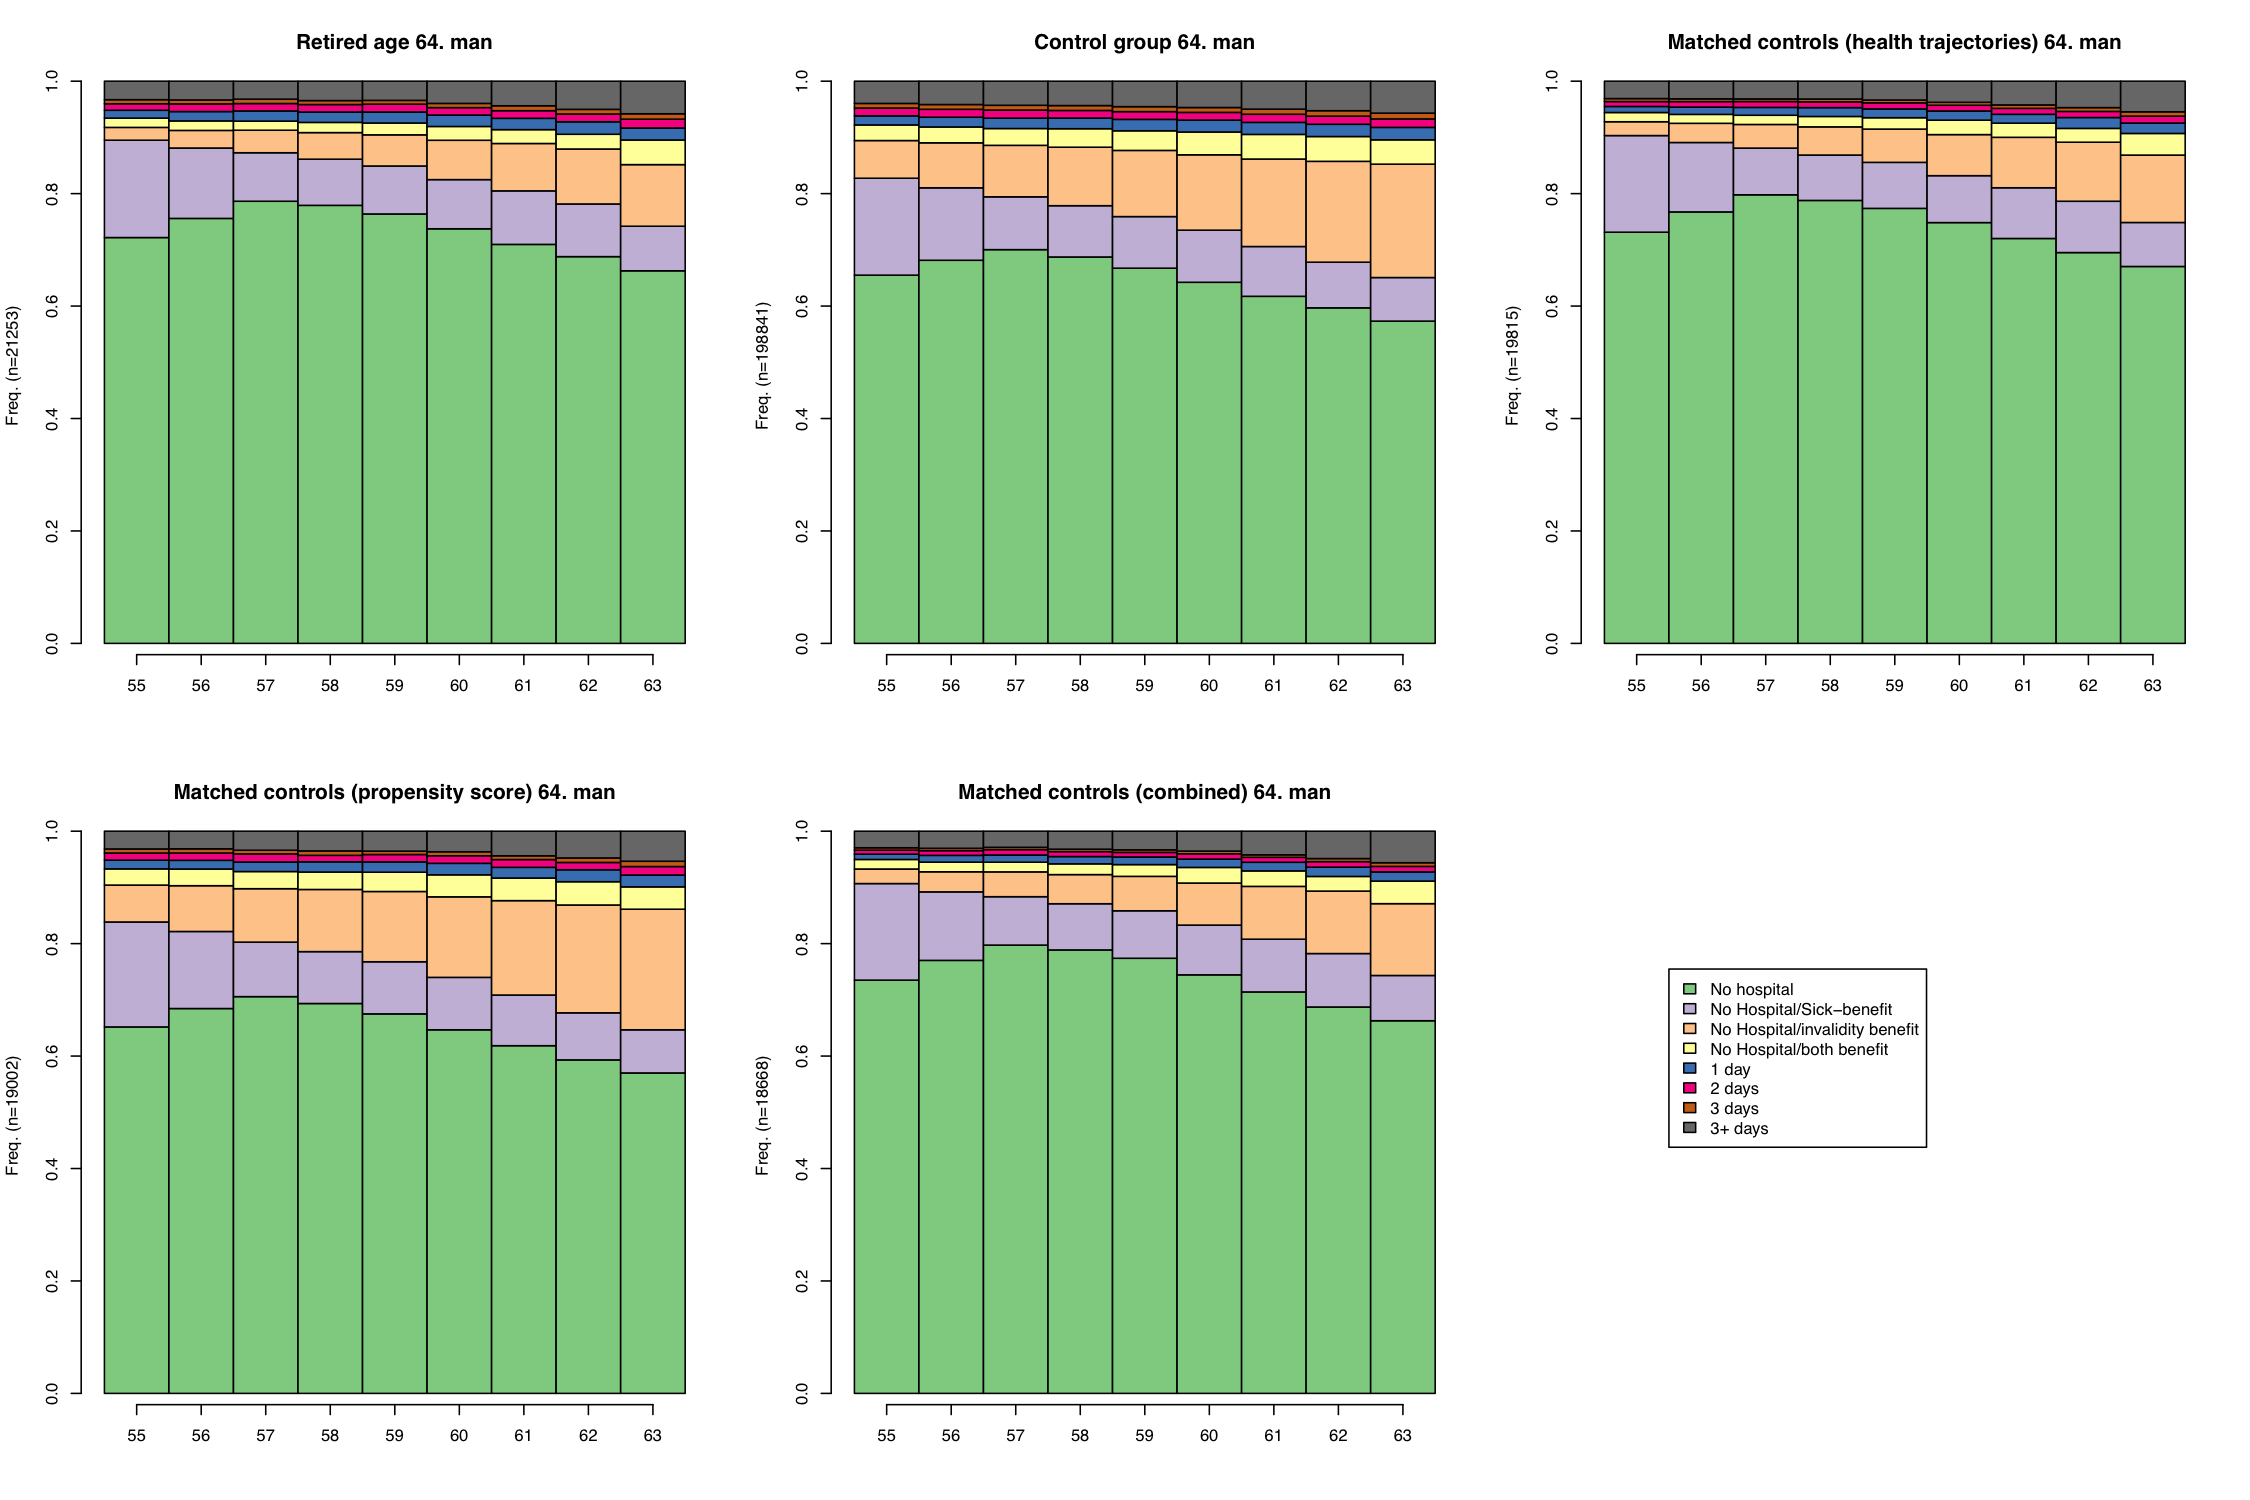
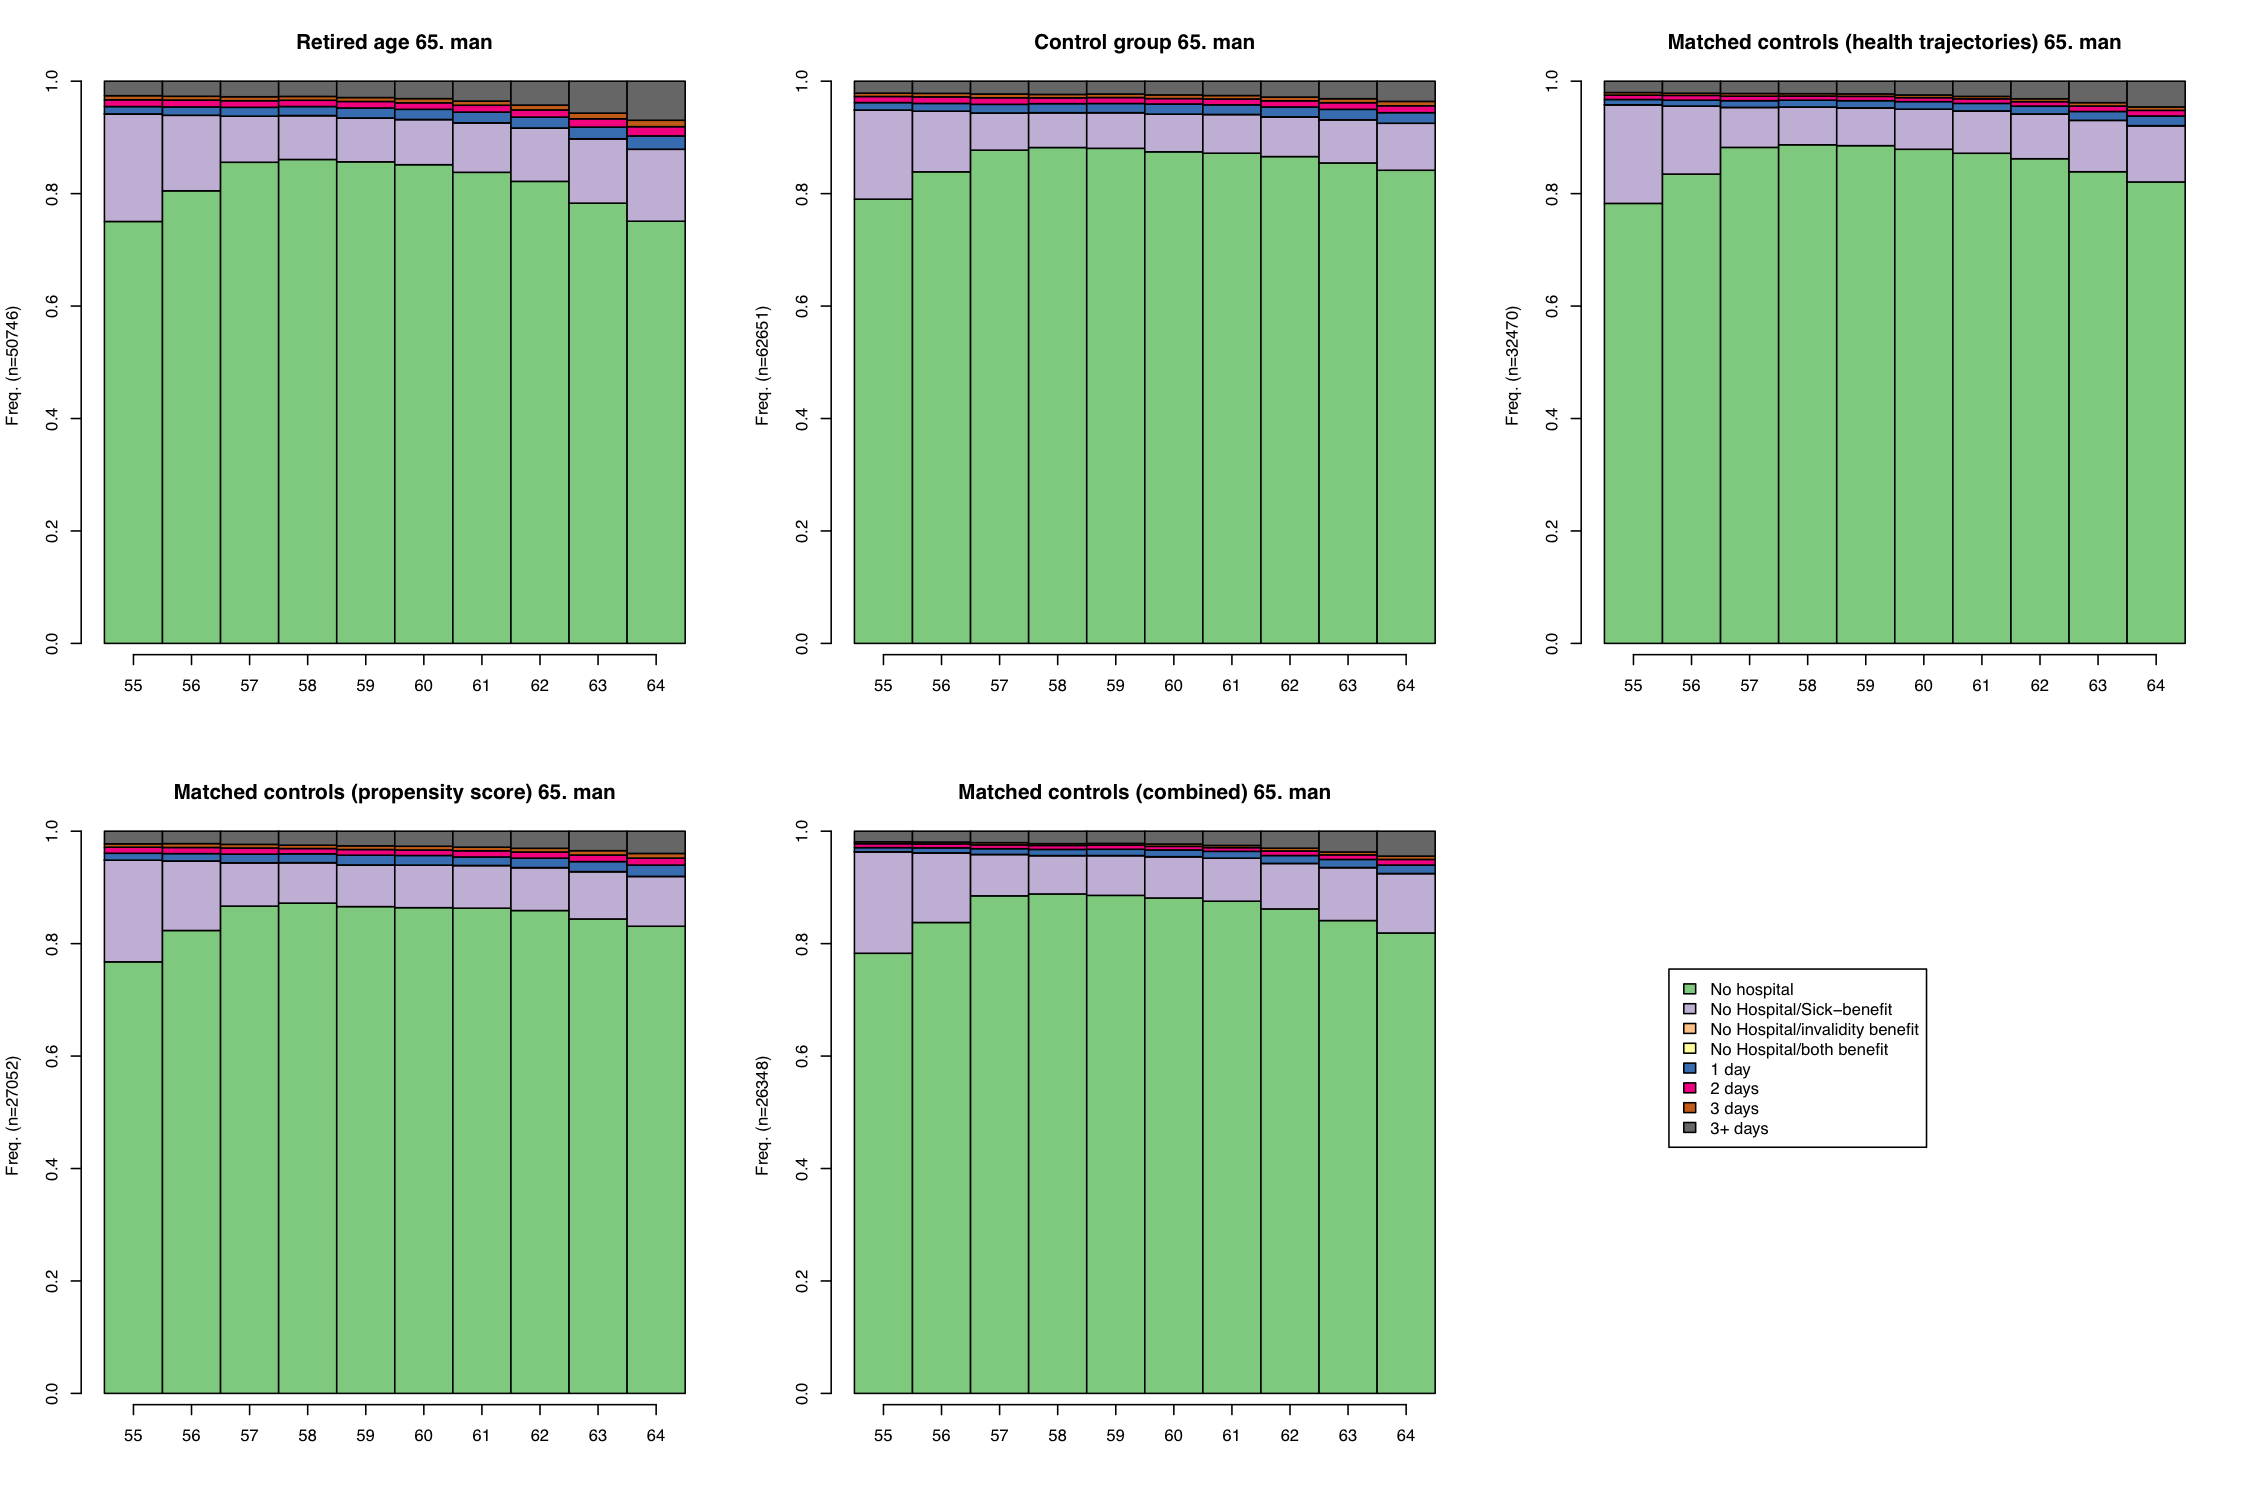
Distribution plots of health trajectories under different matching strategies.

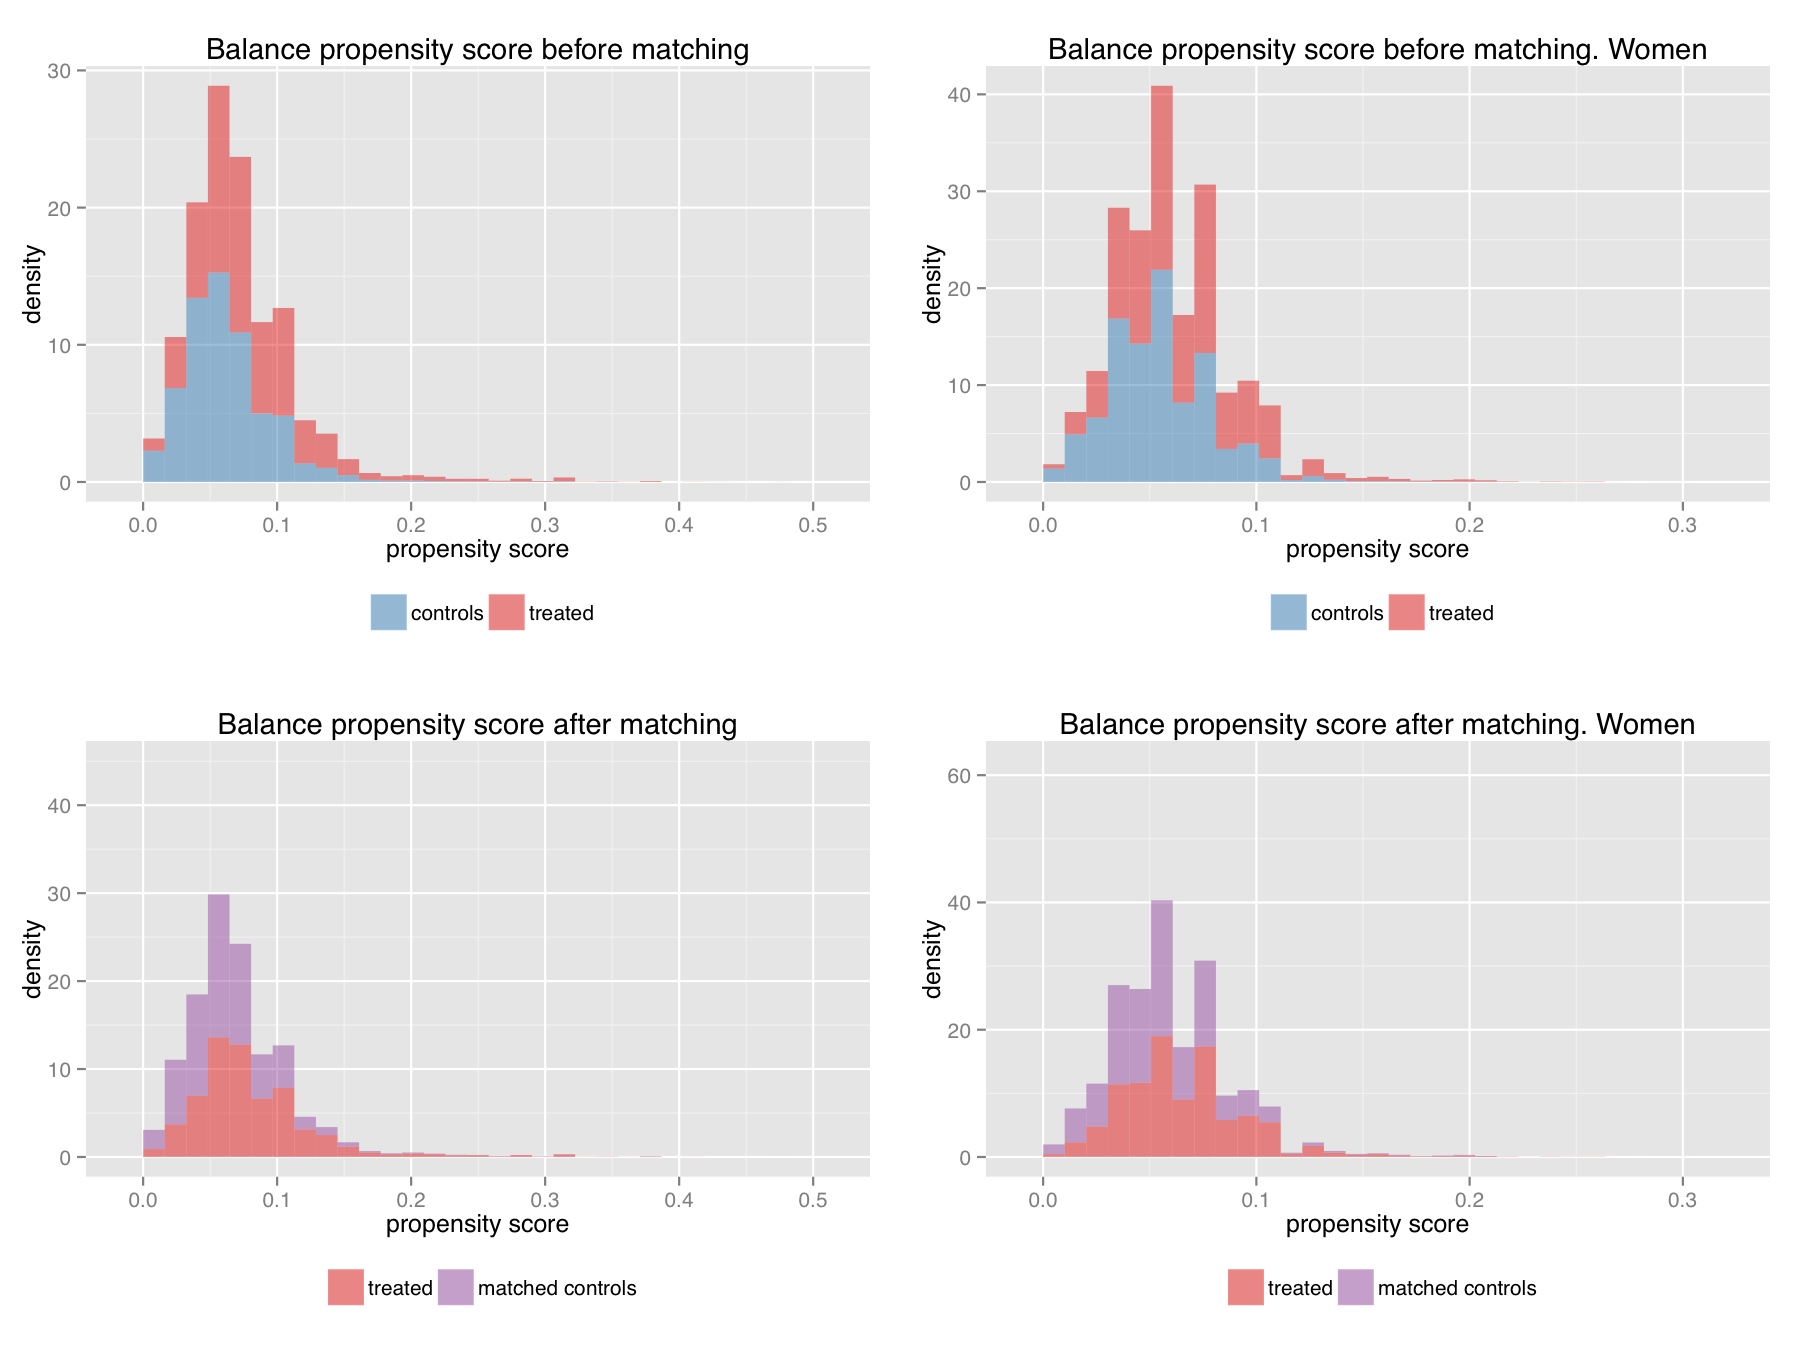
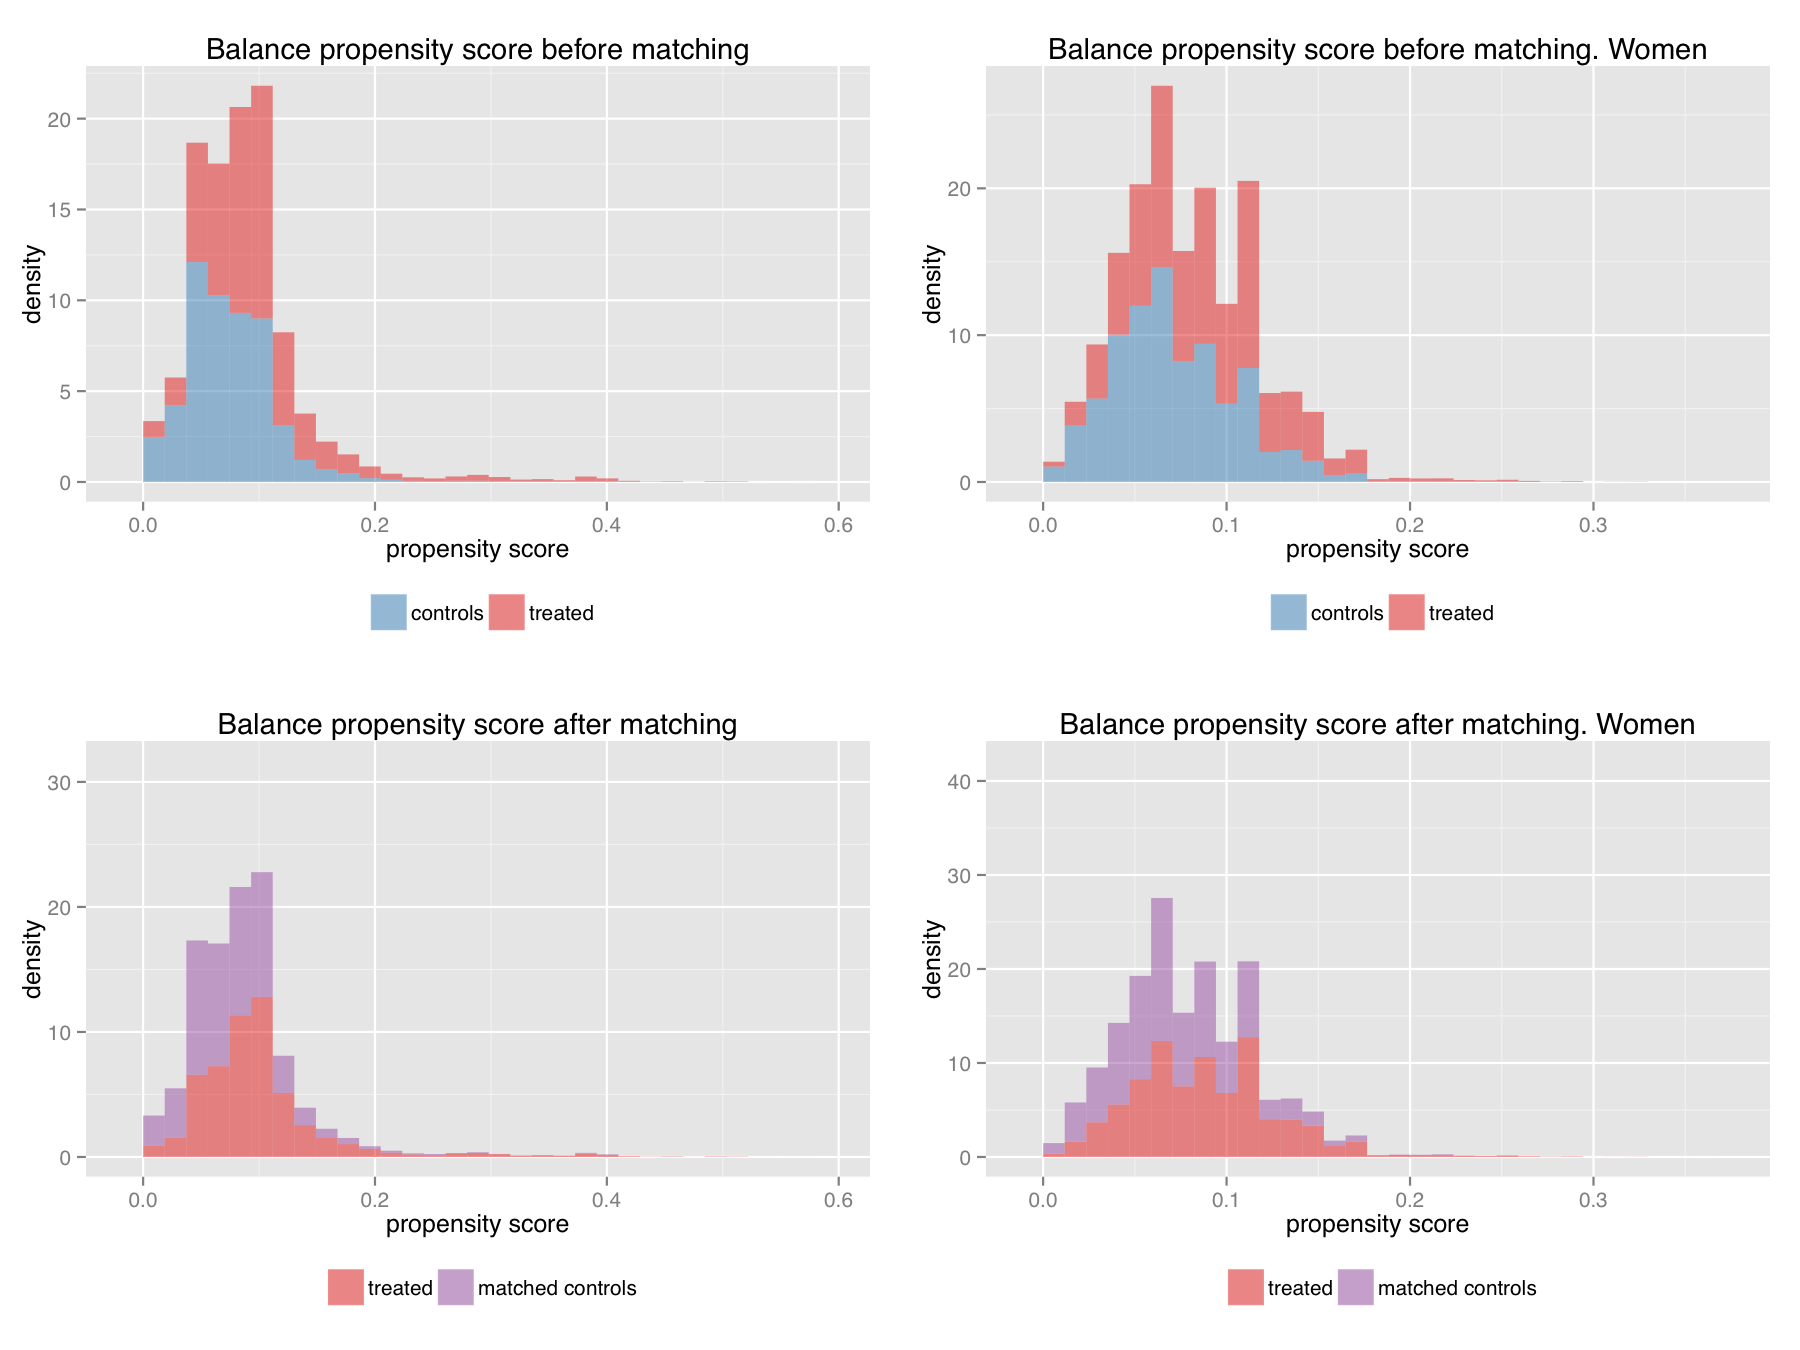
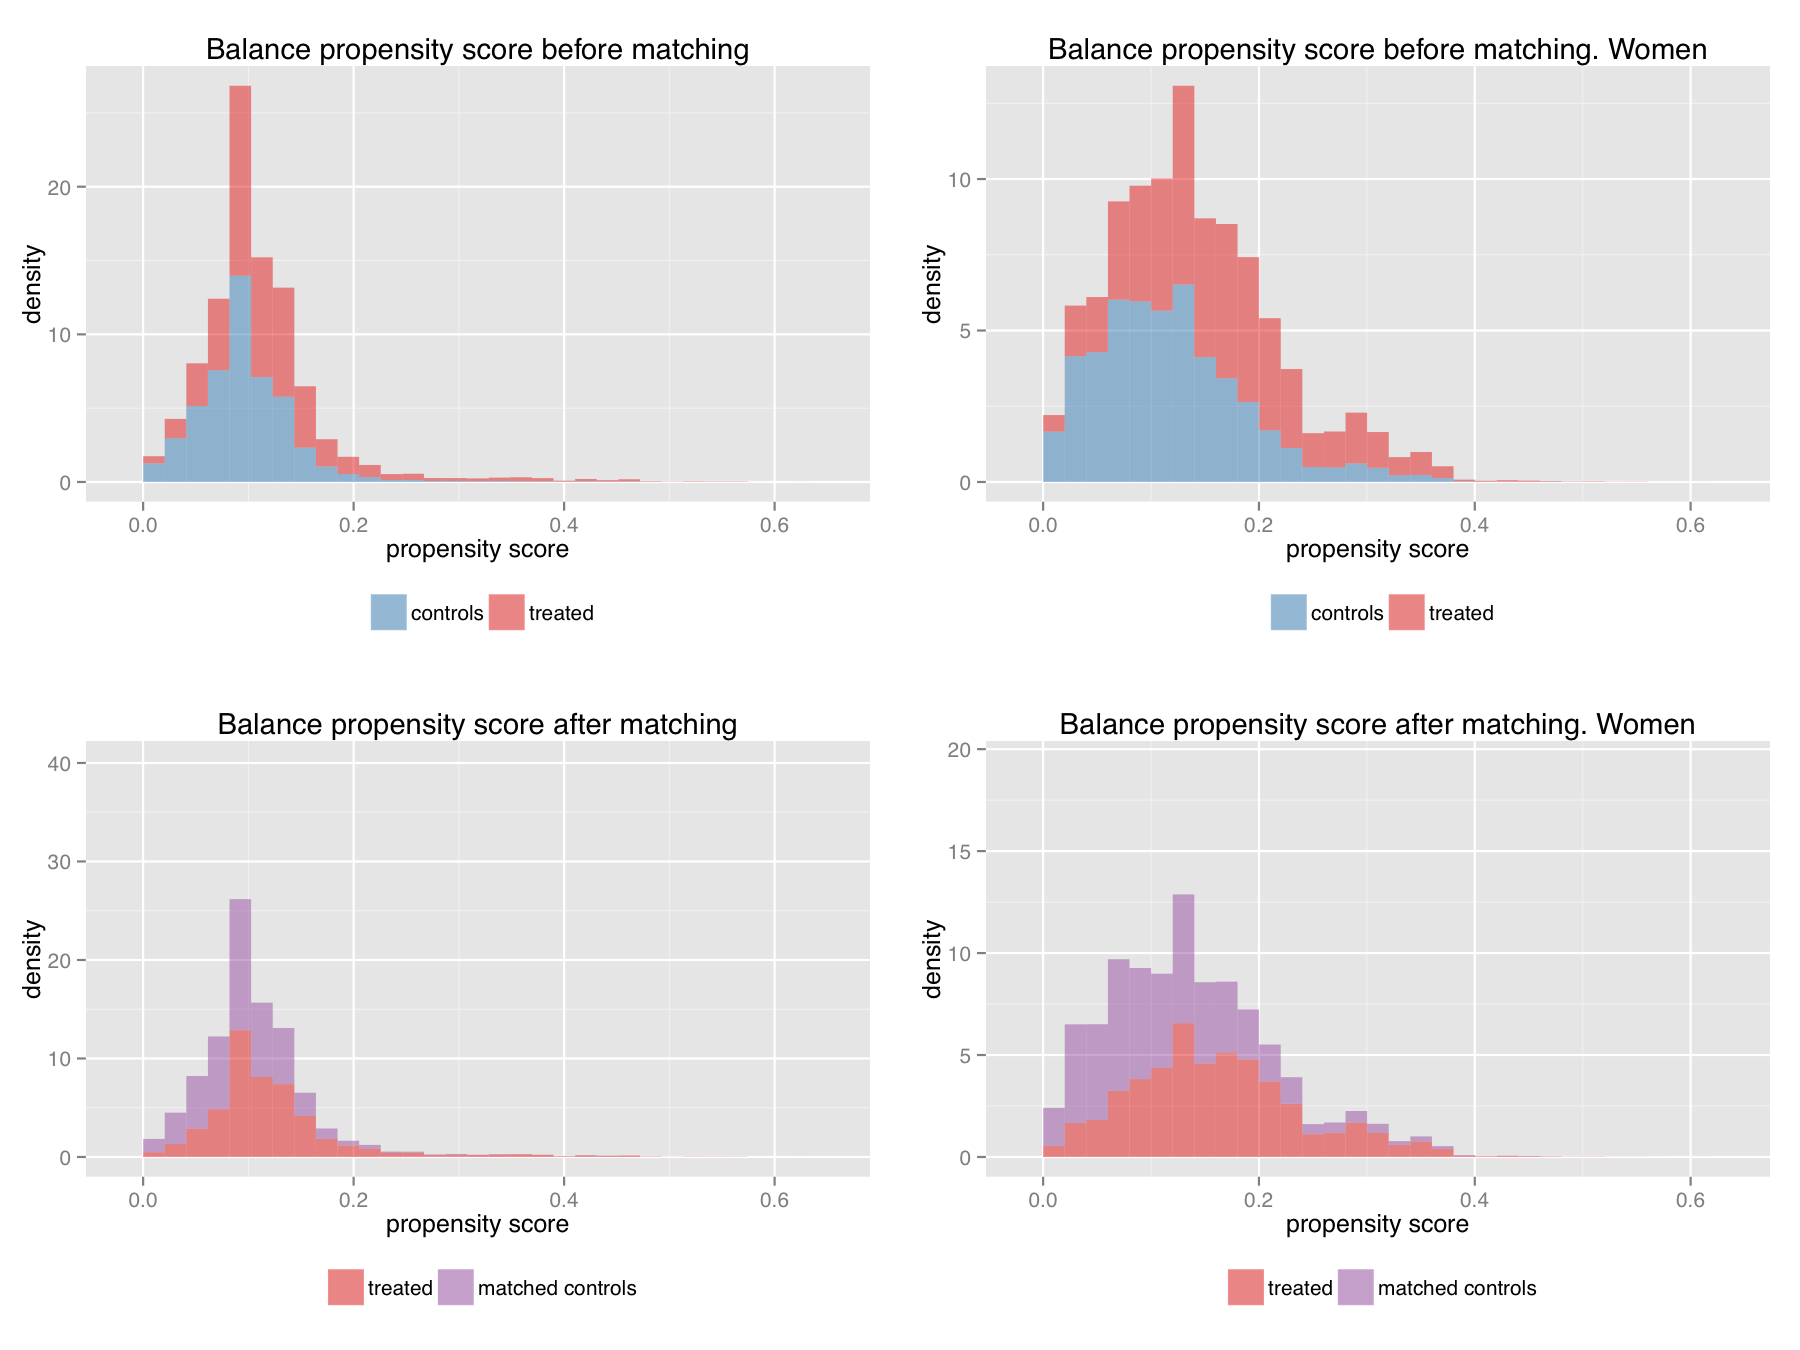
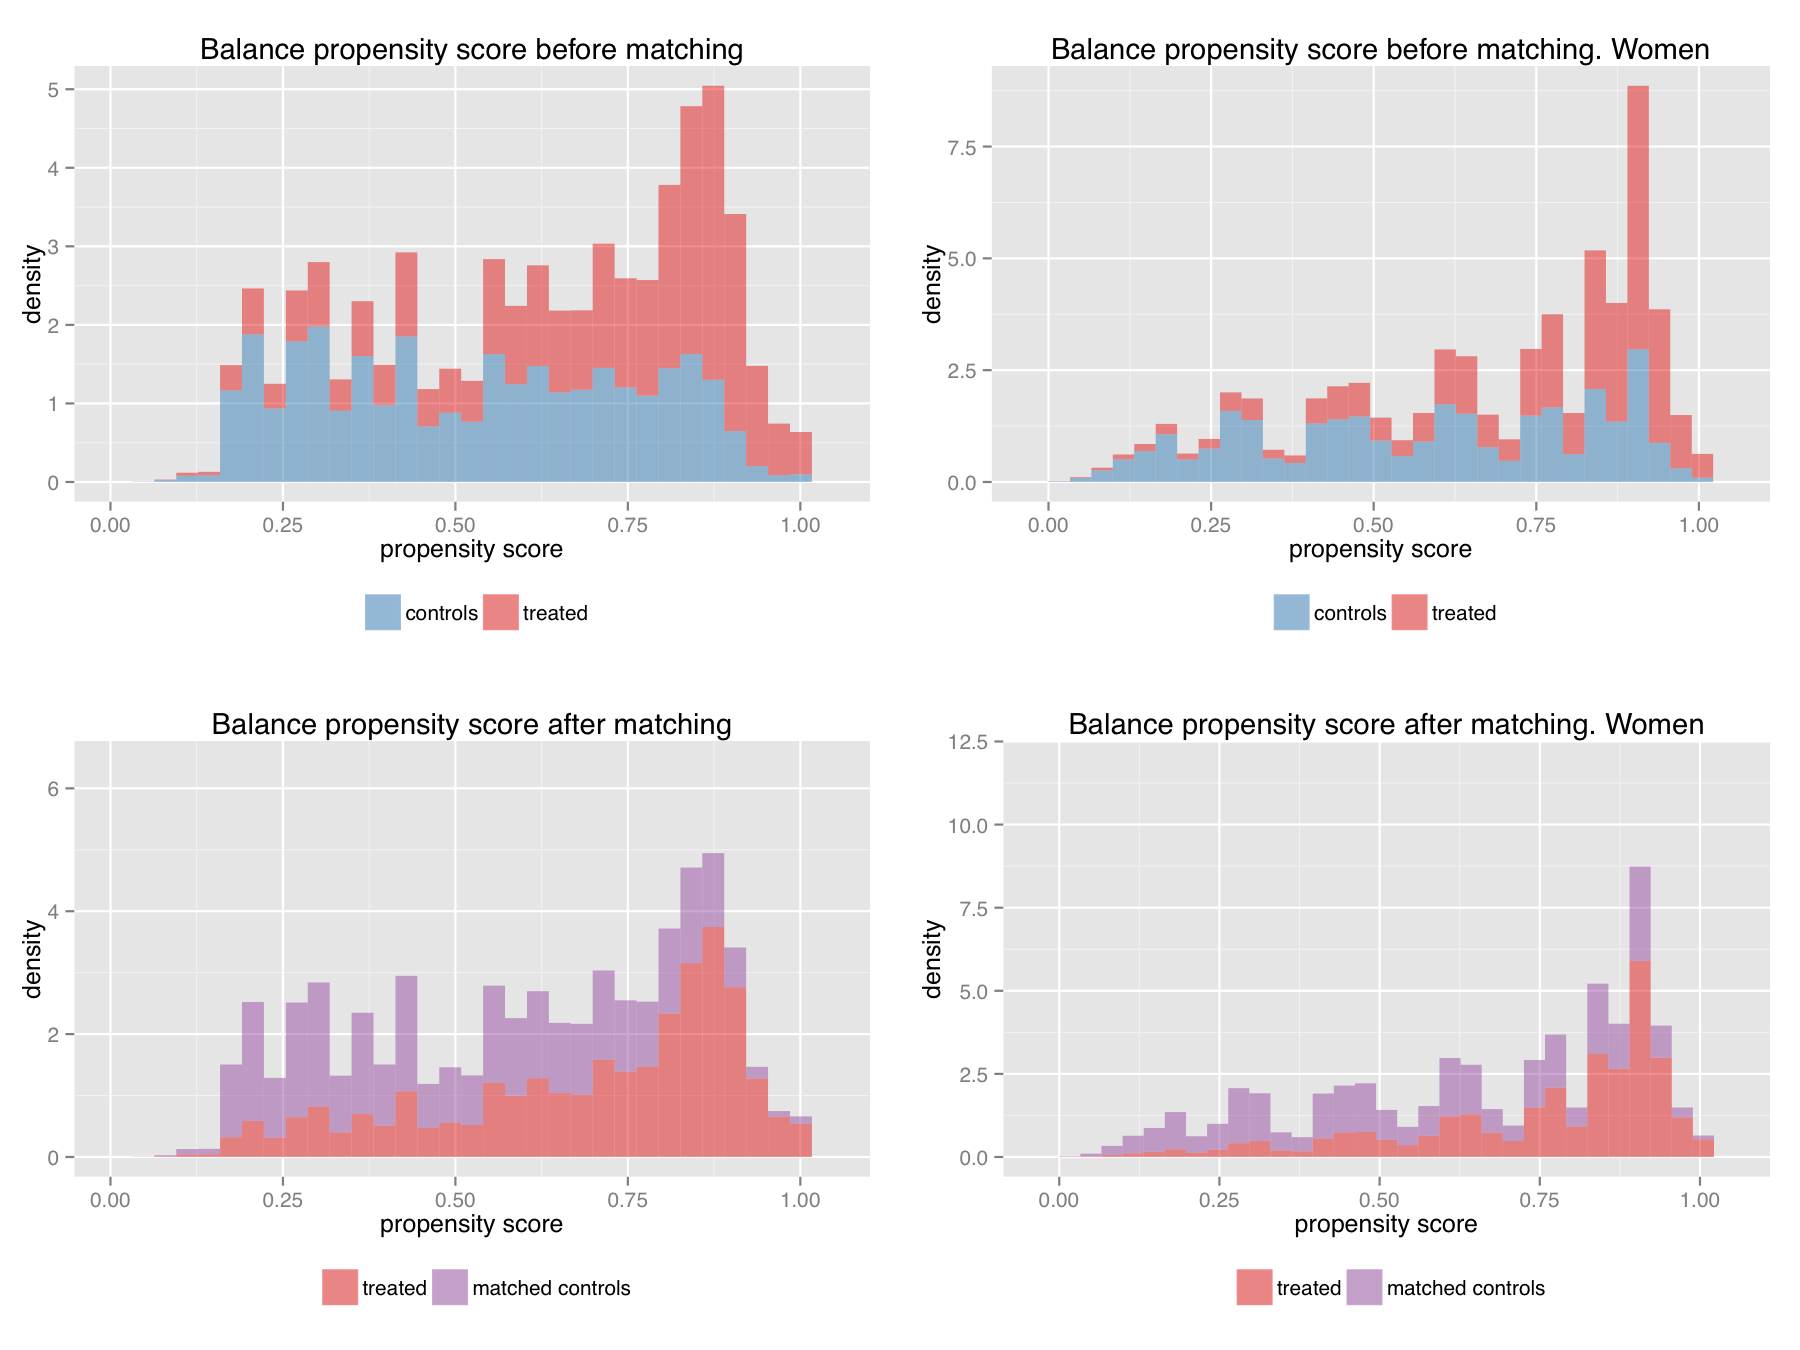
Common support under different matching strategies.

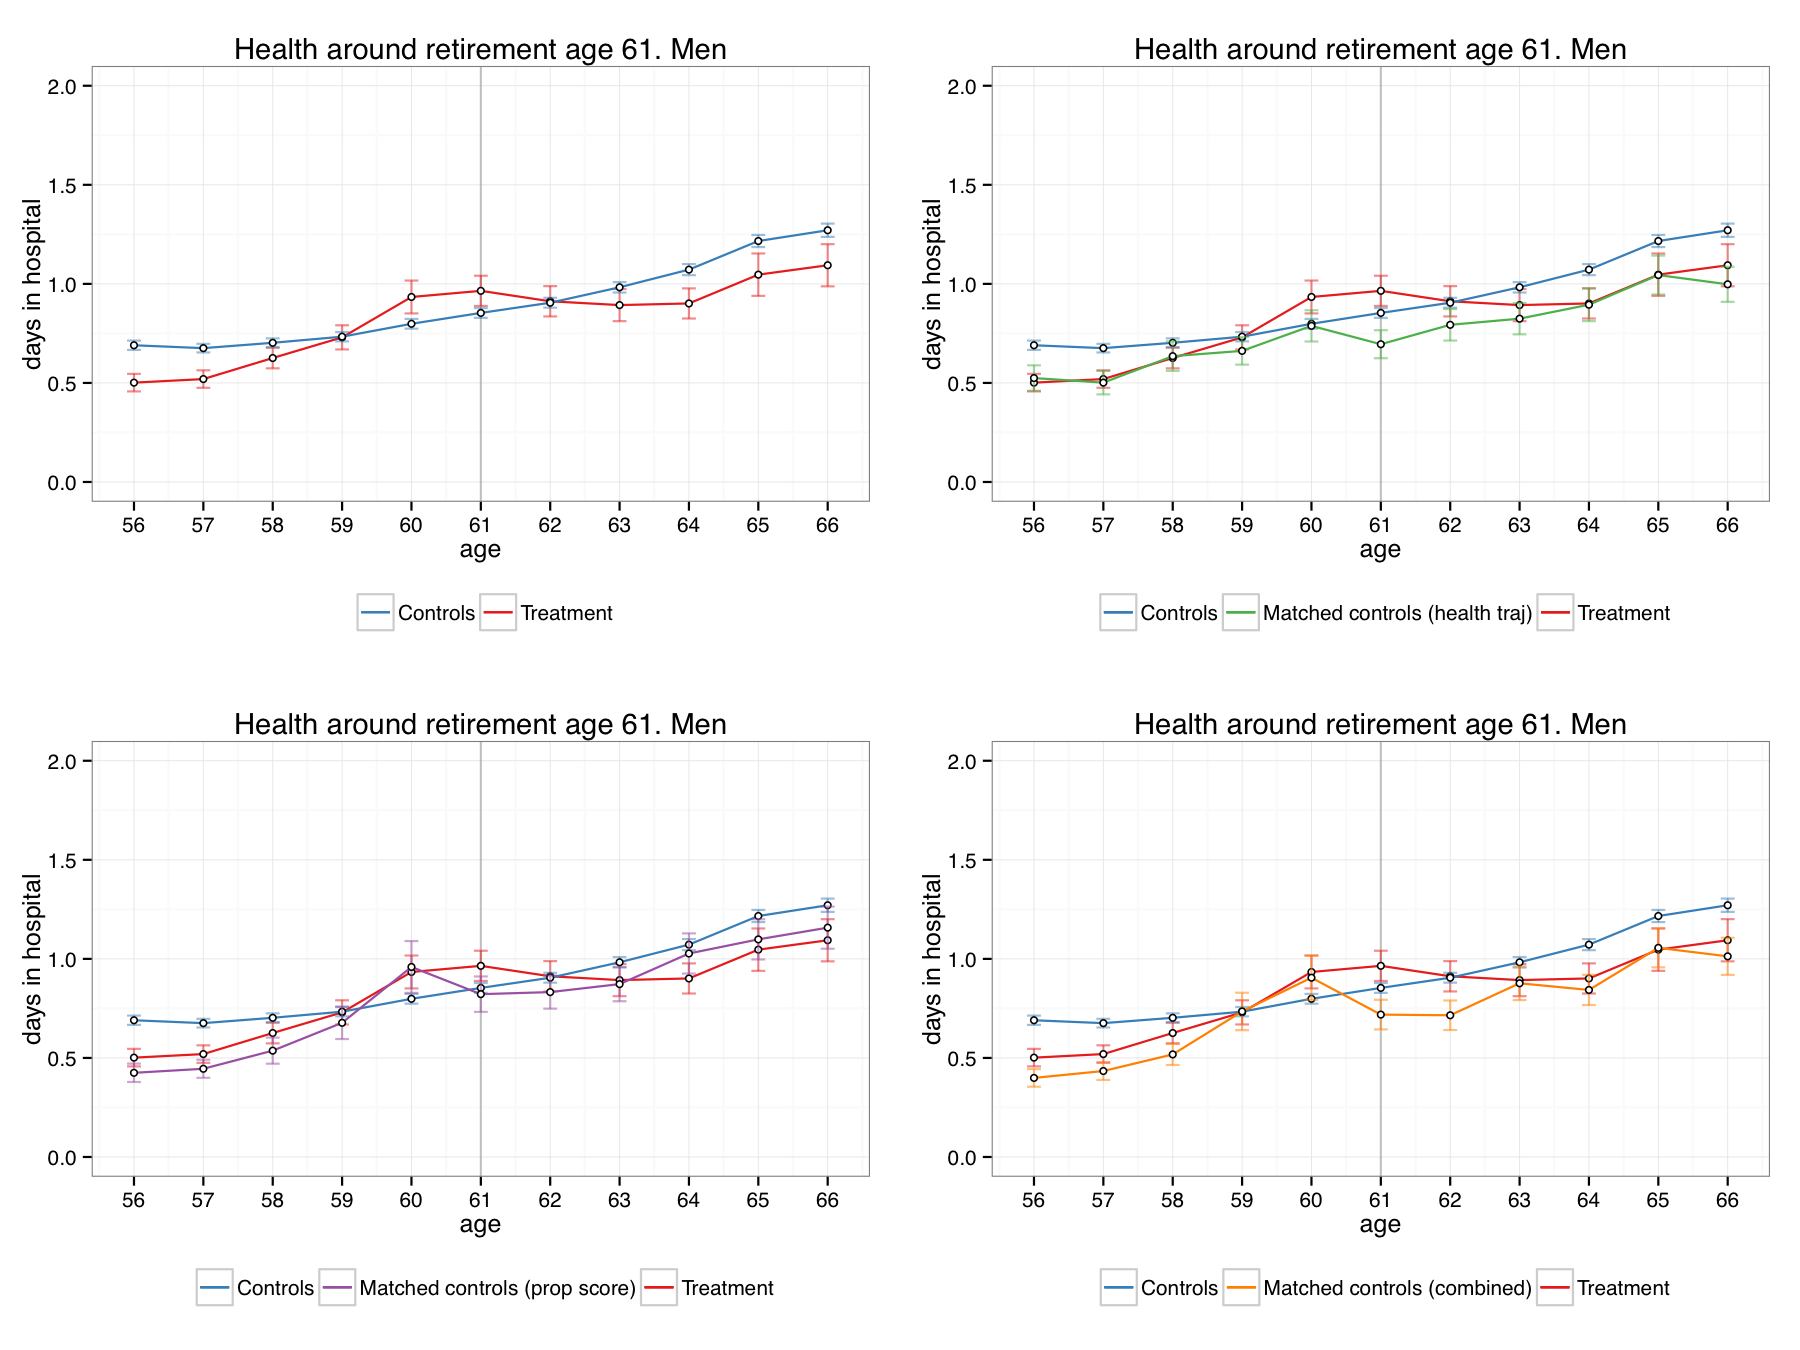
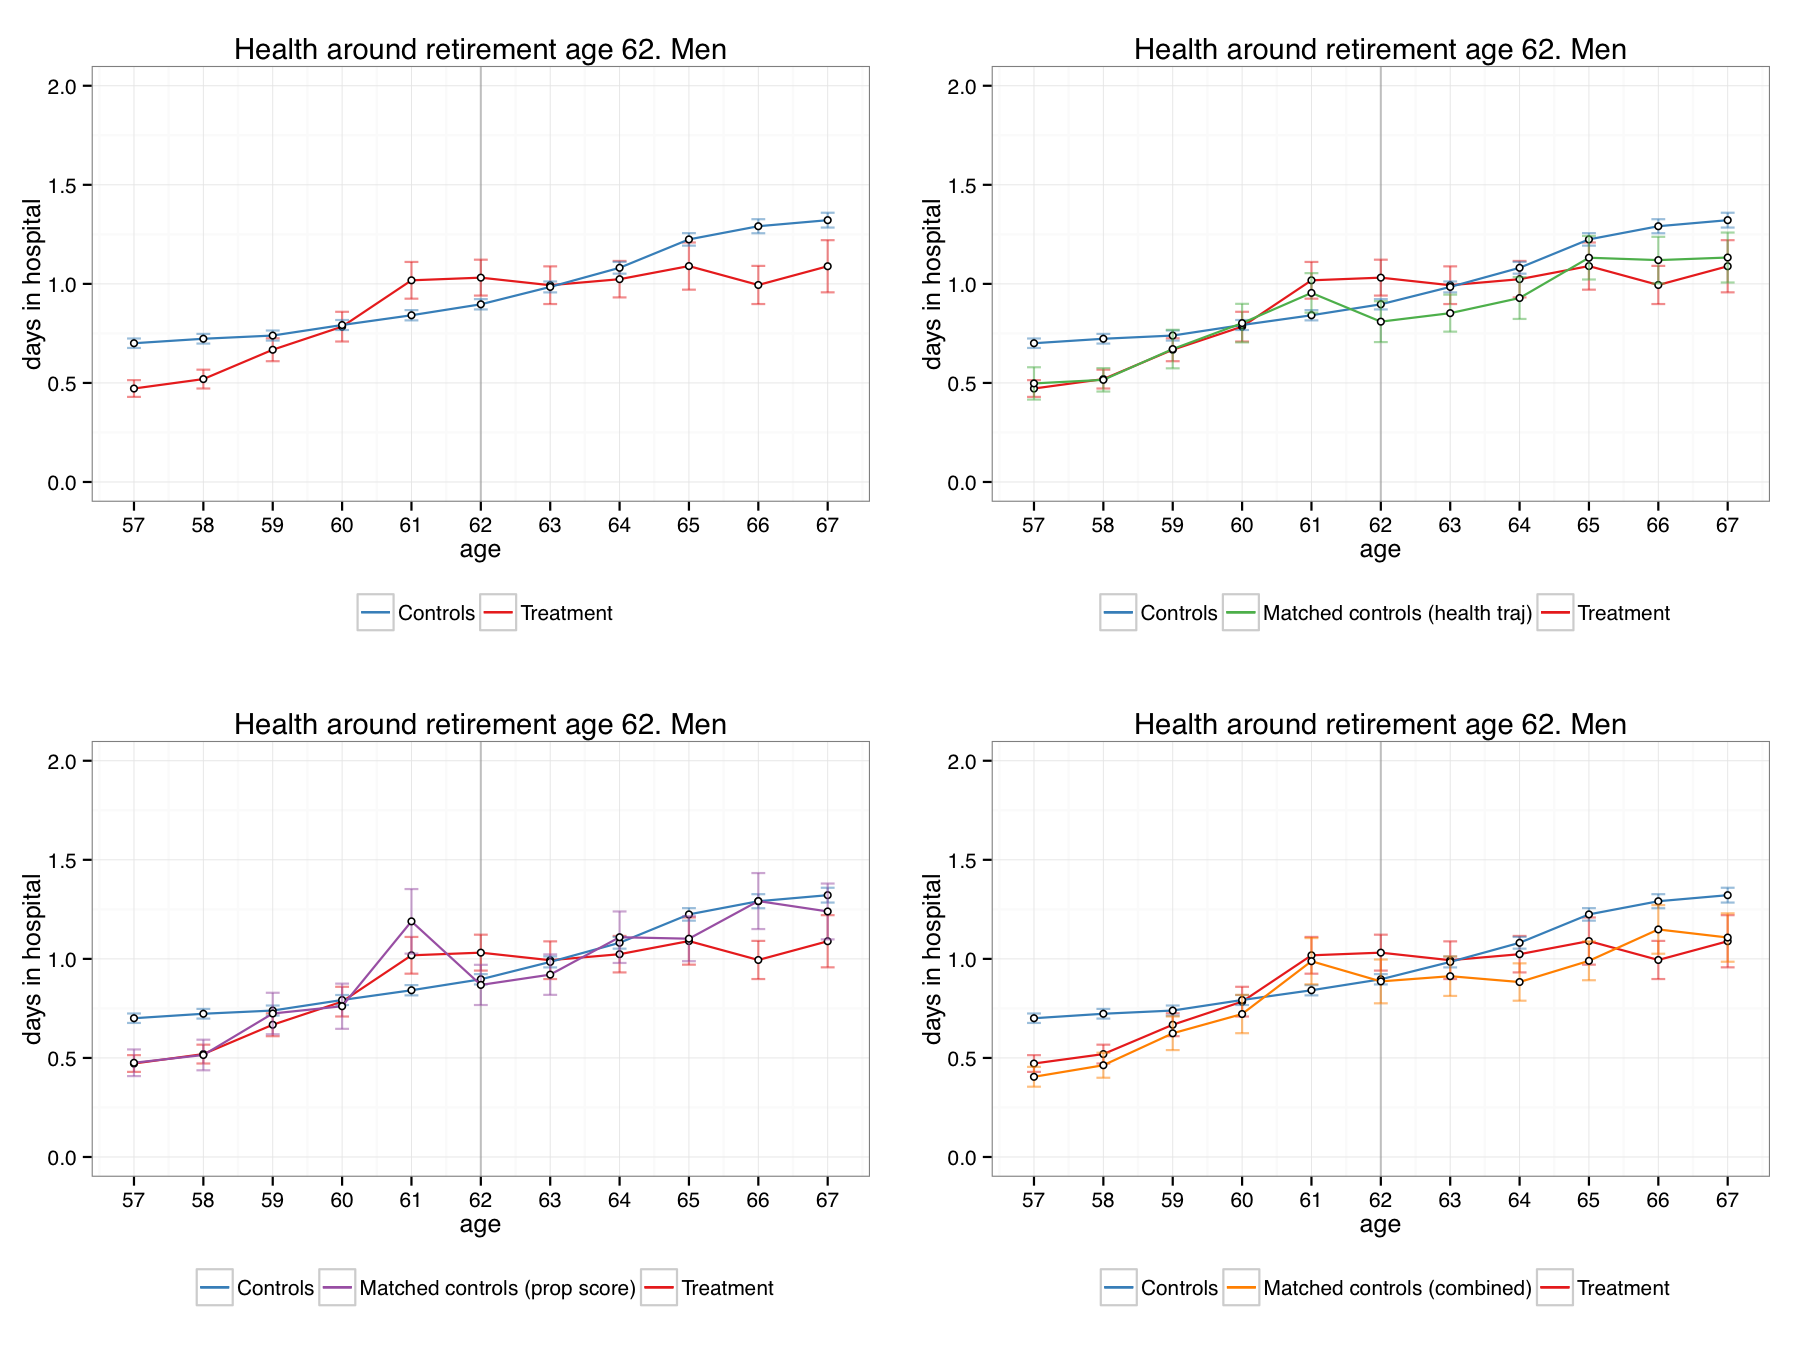
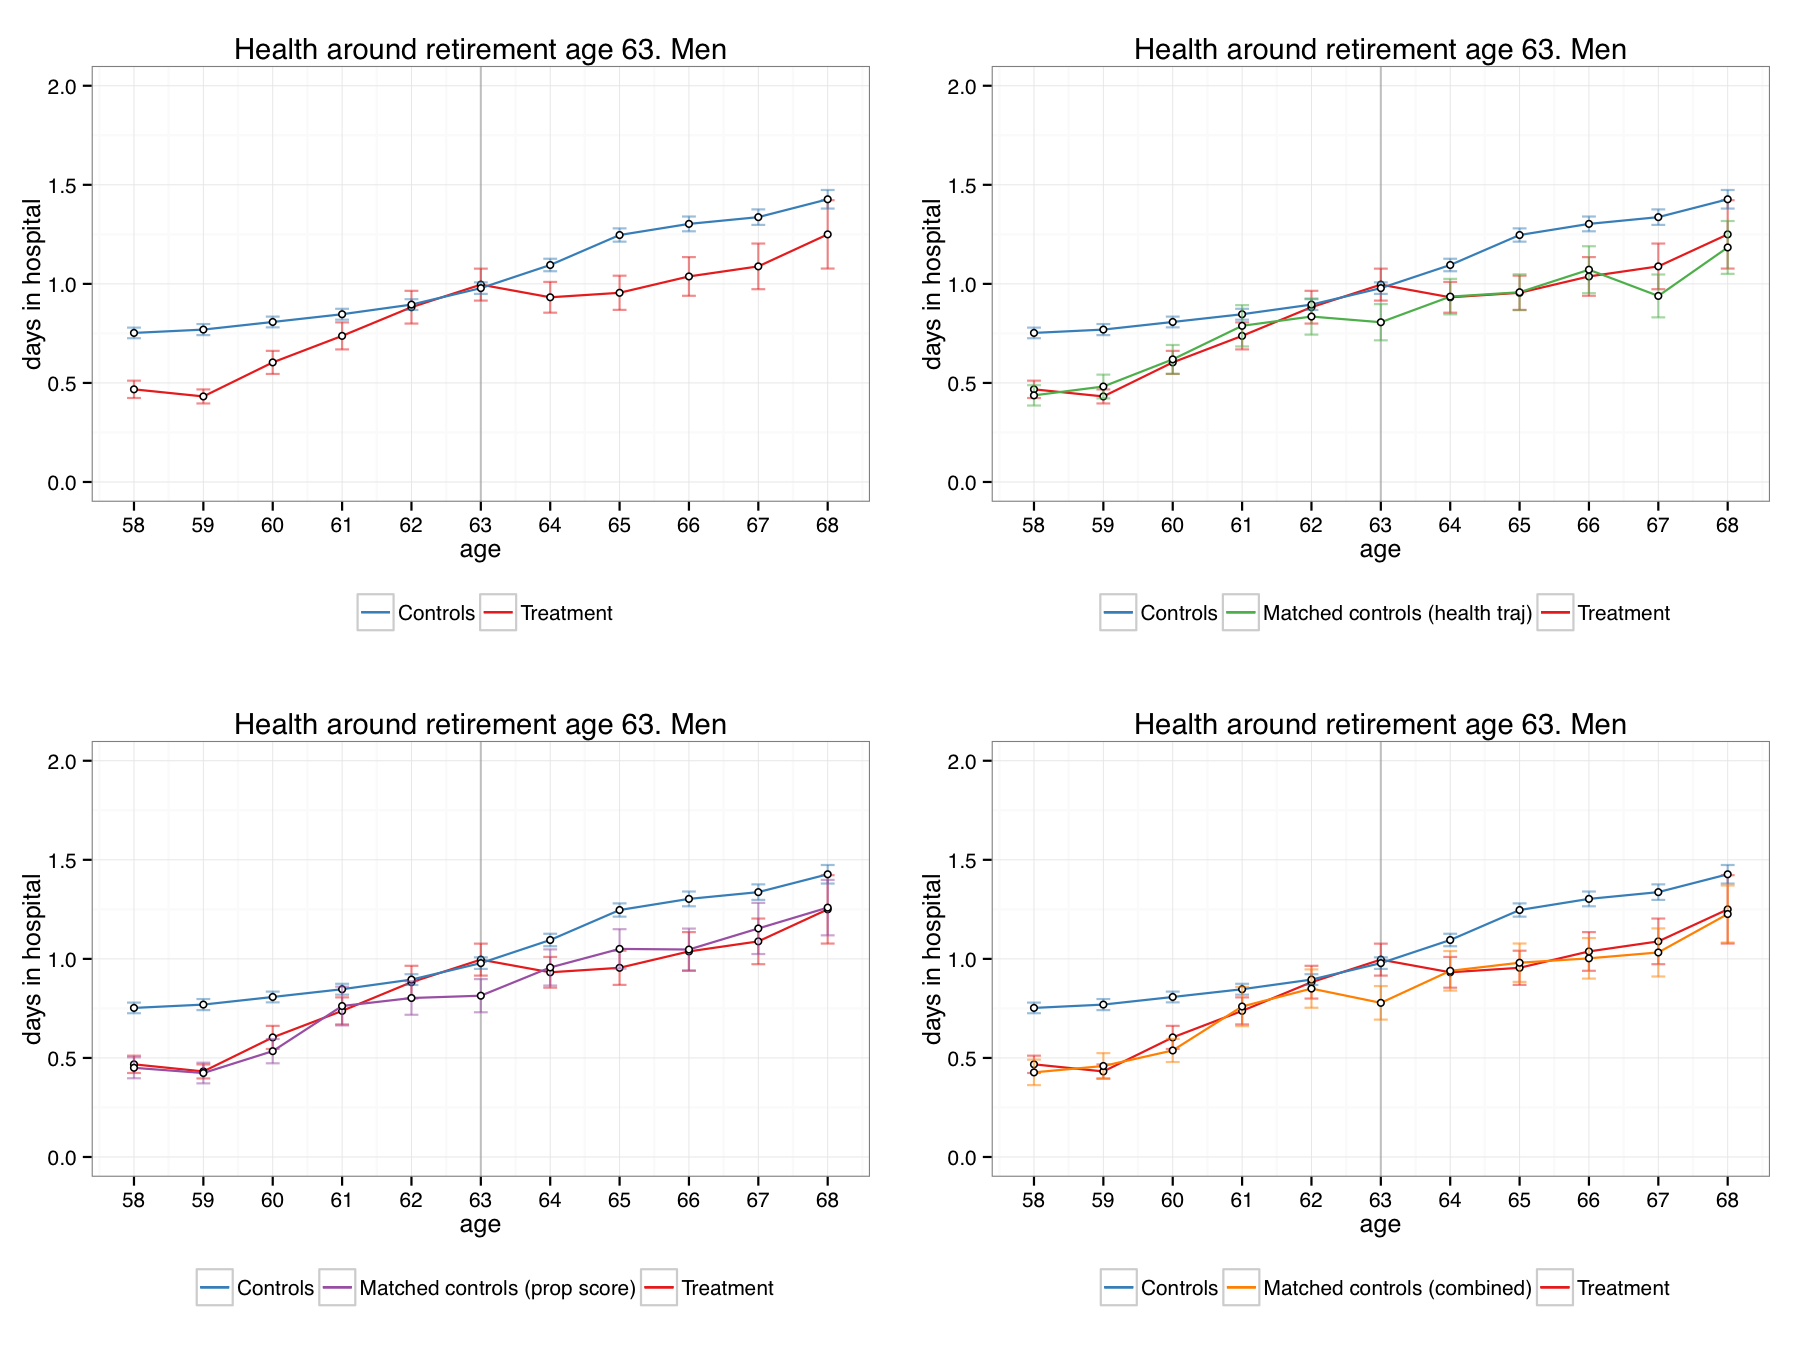
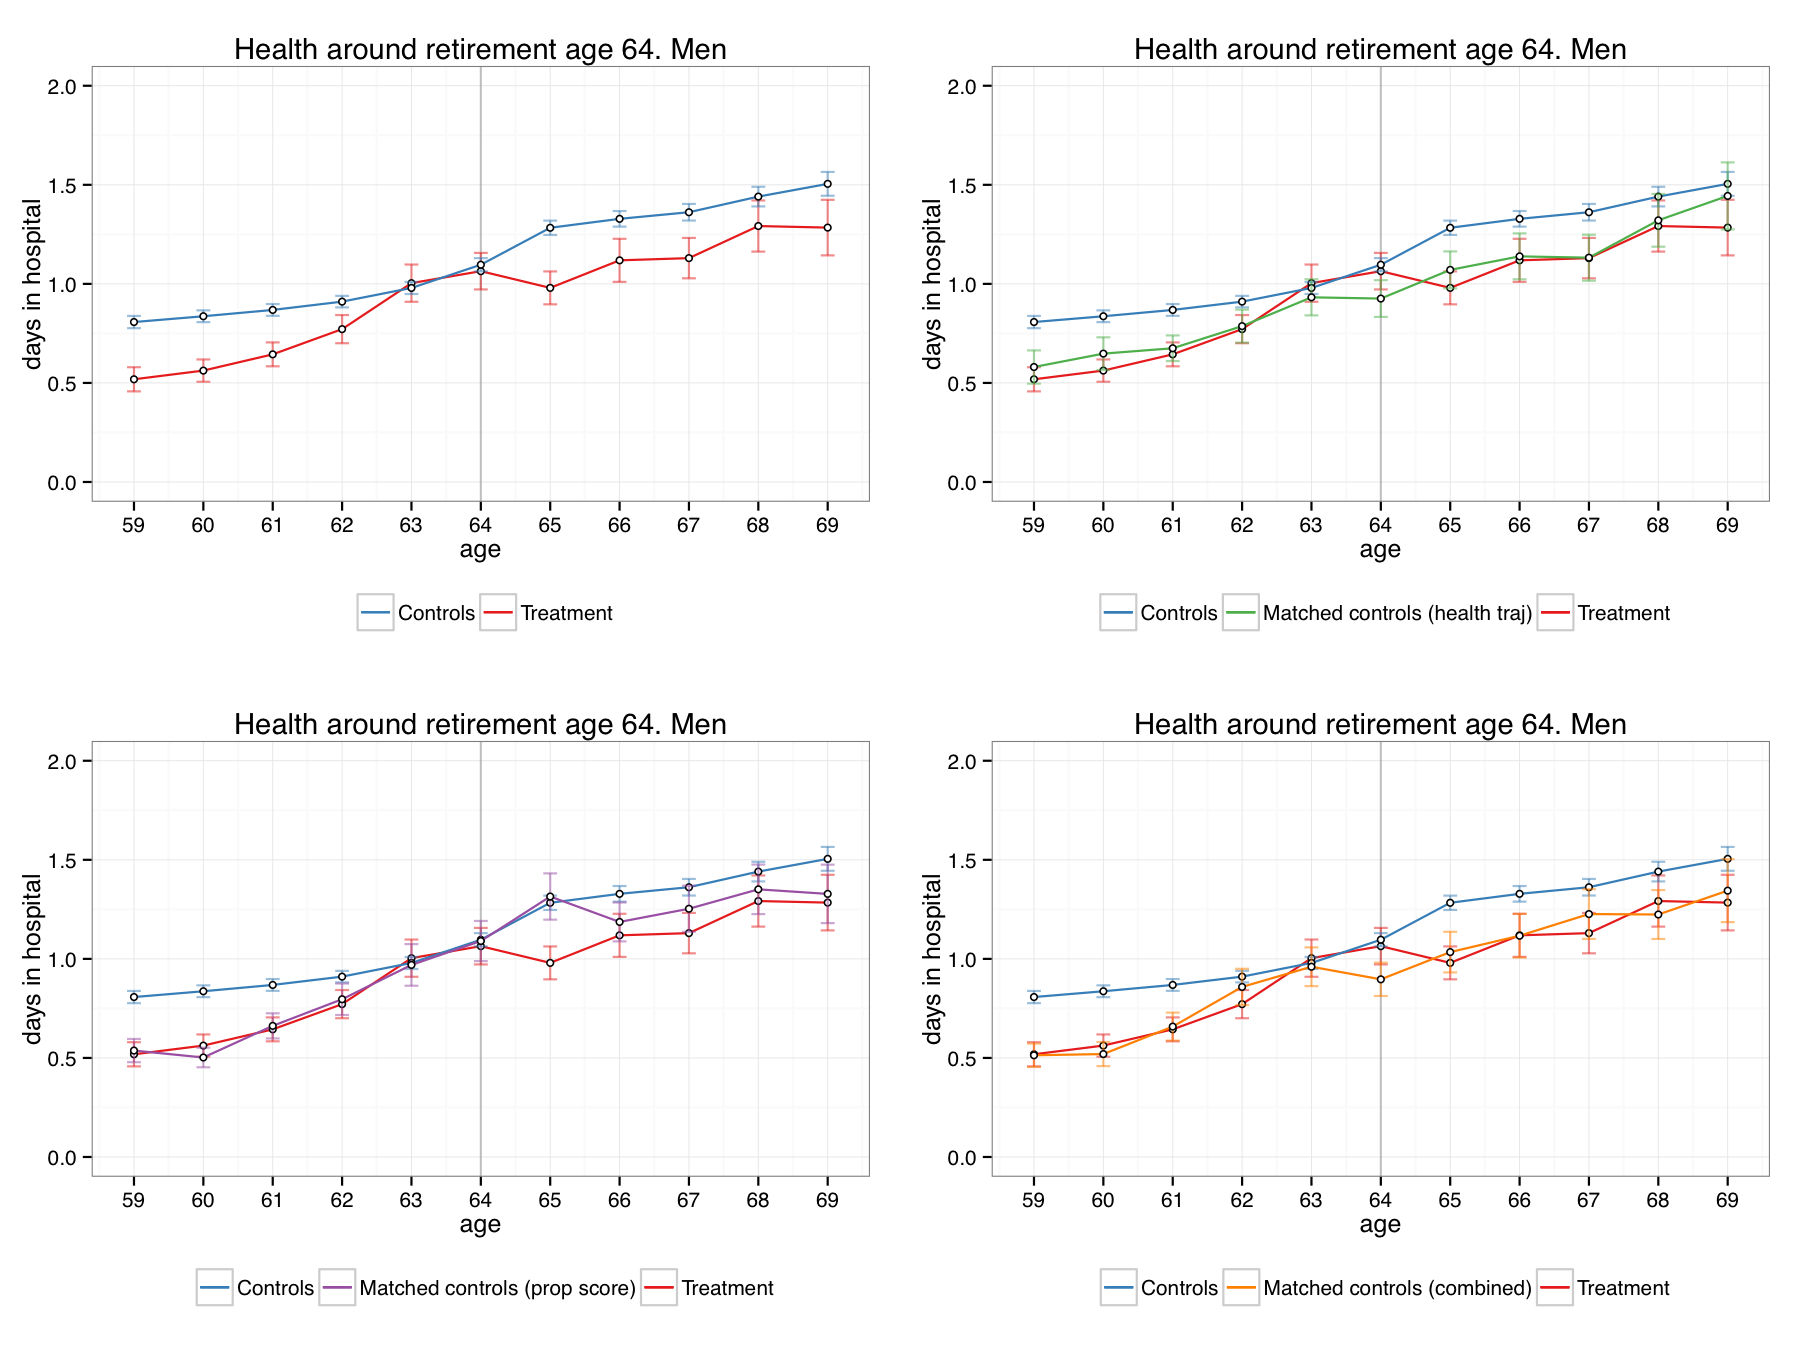
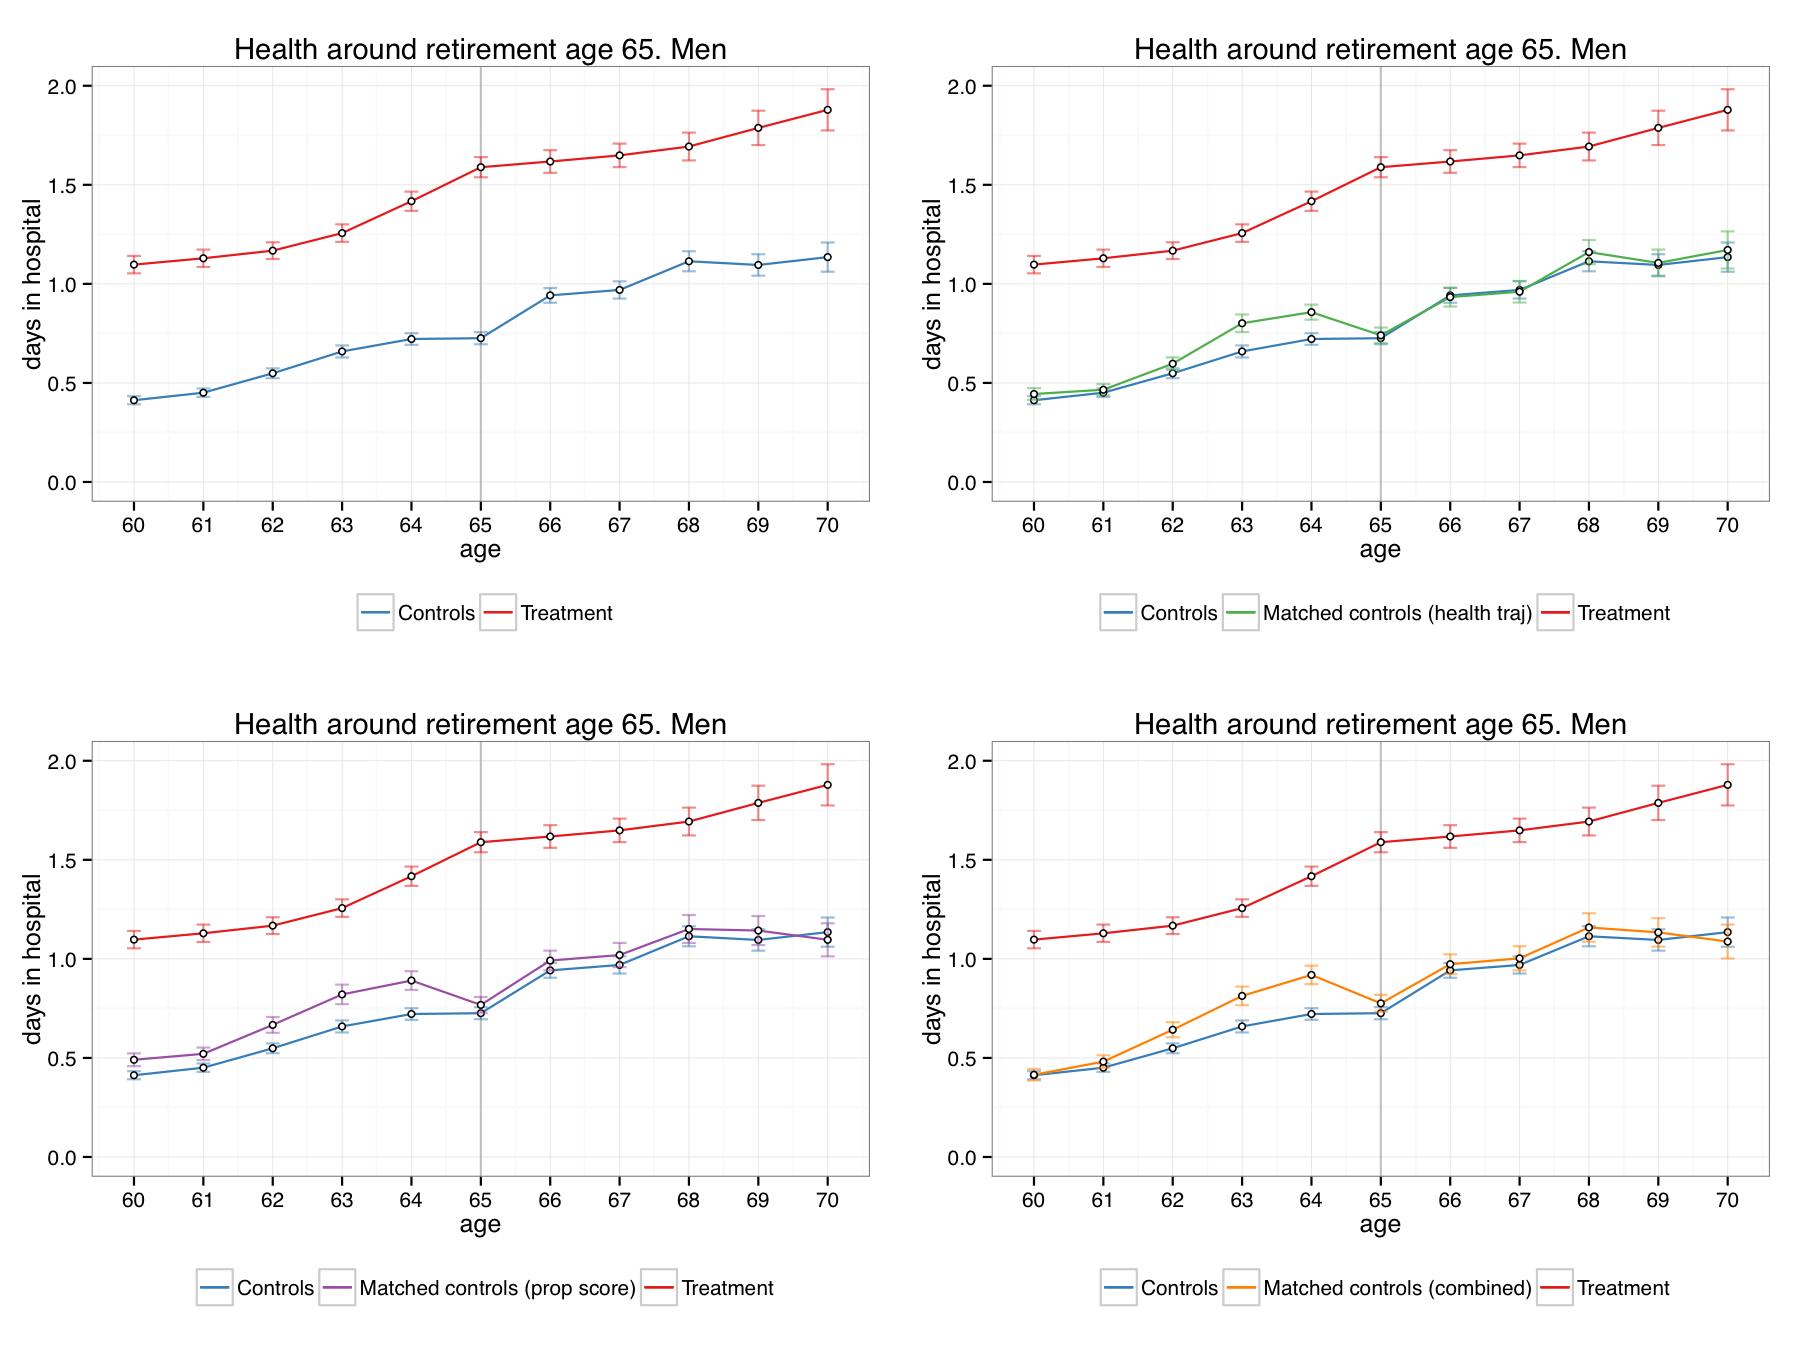
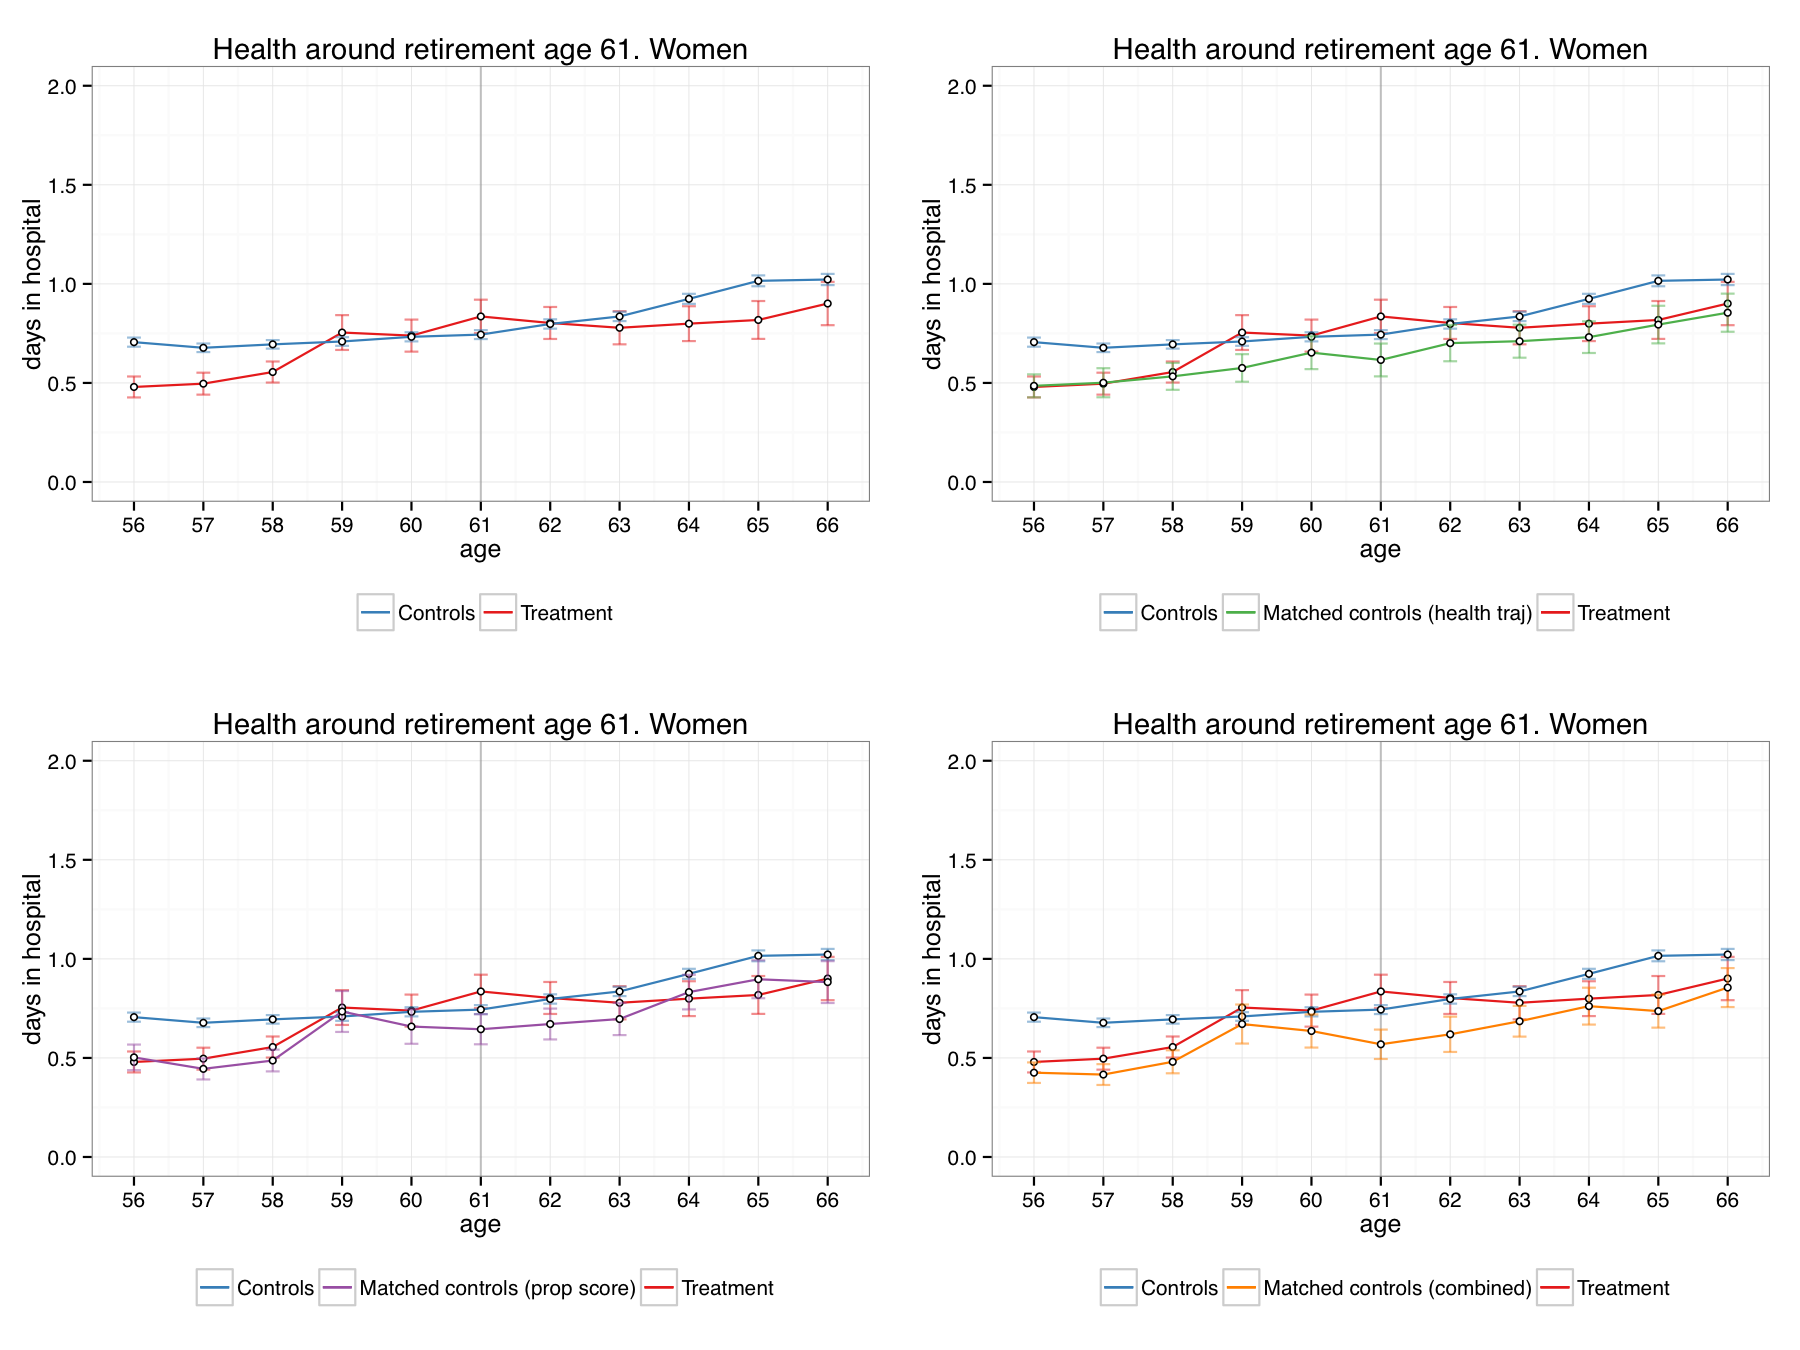
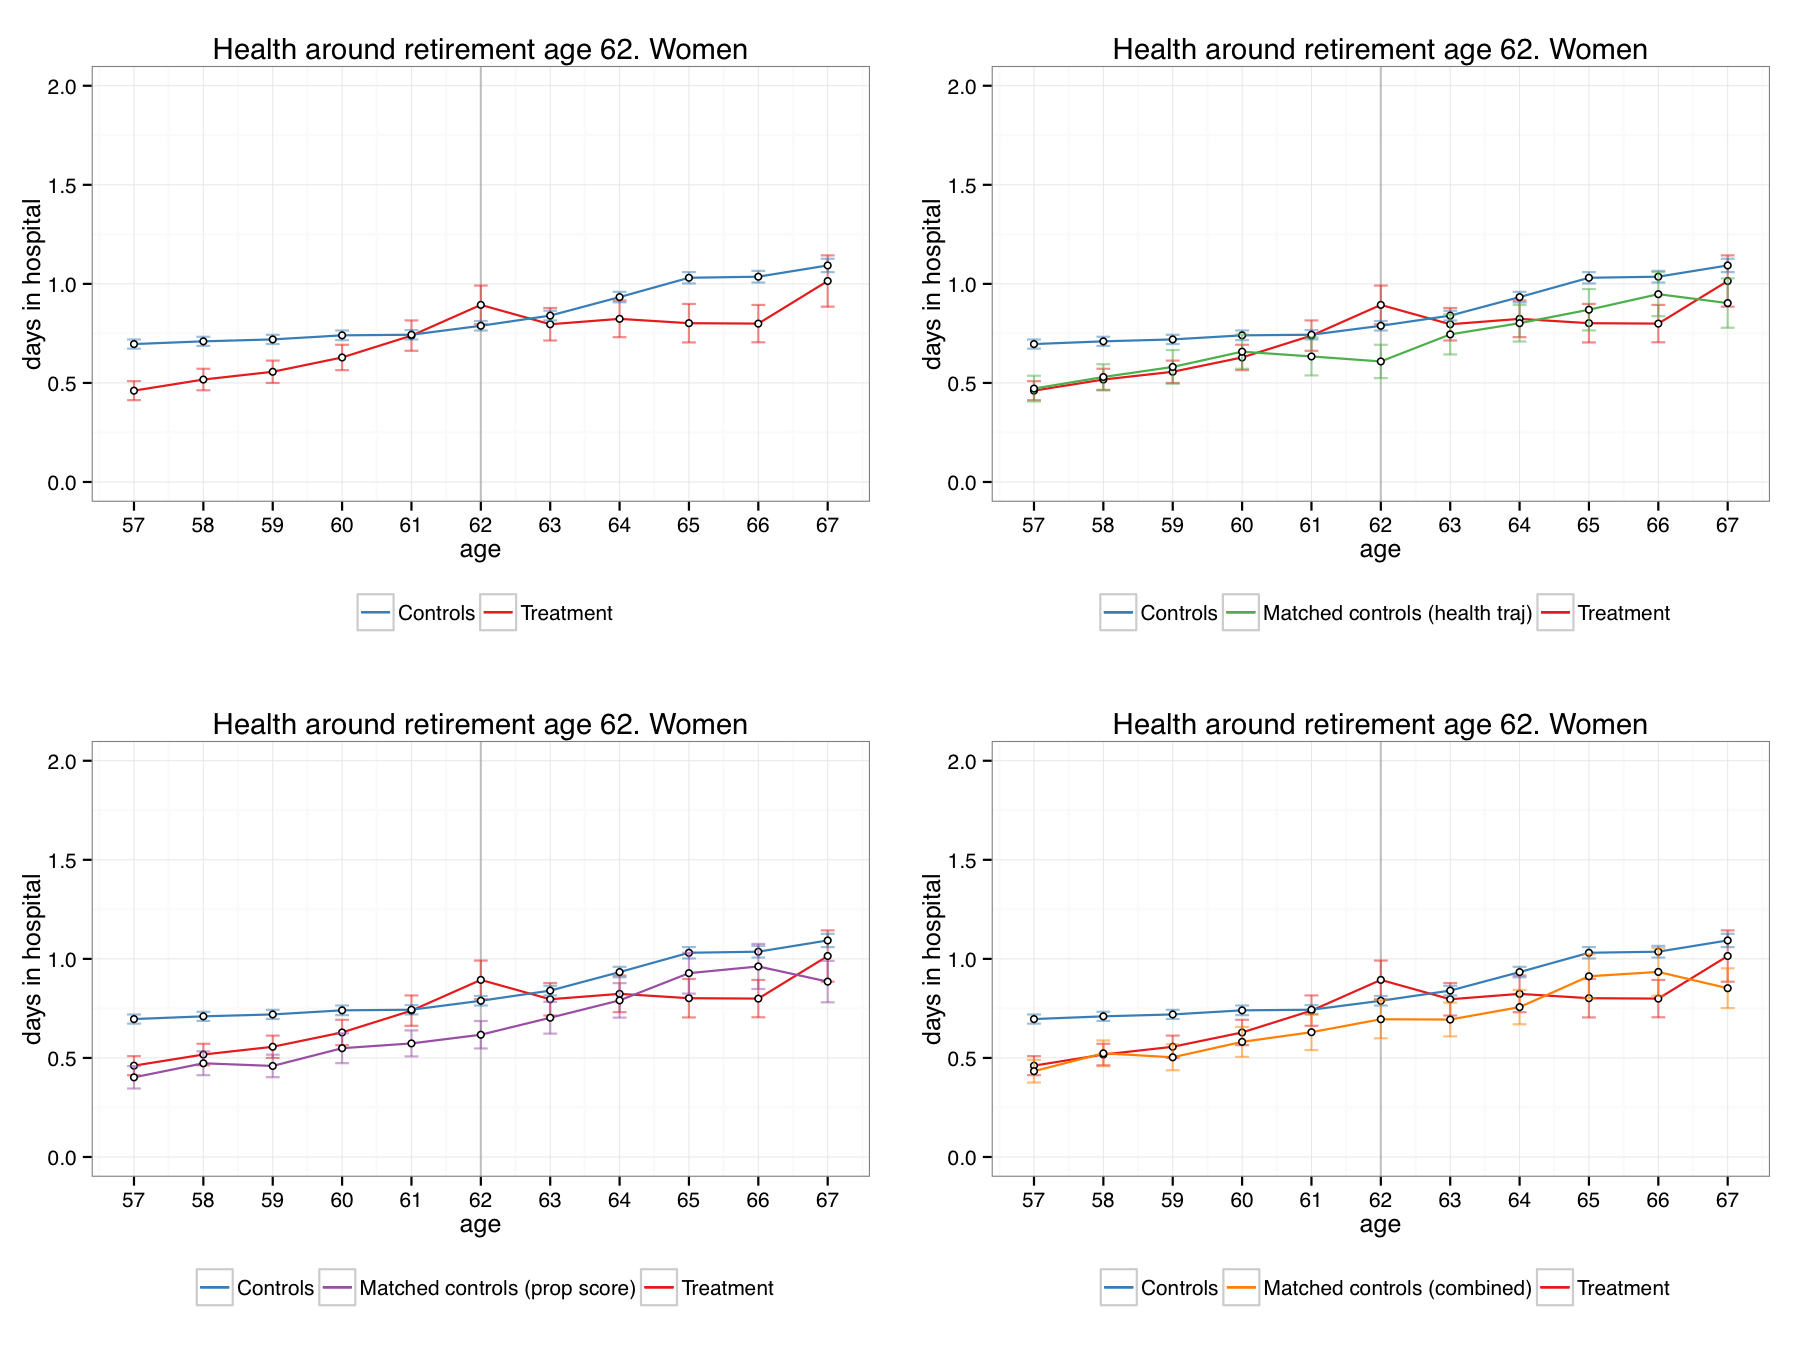
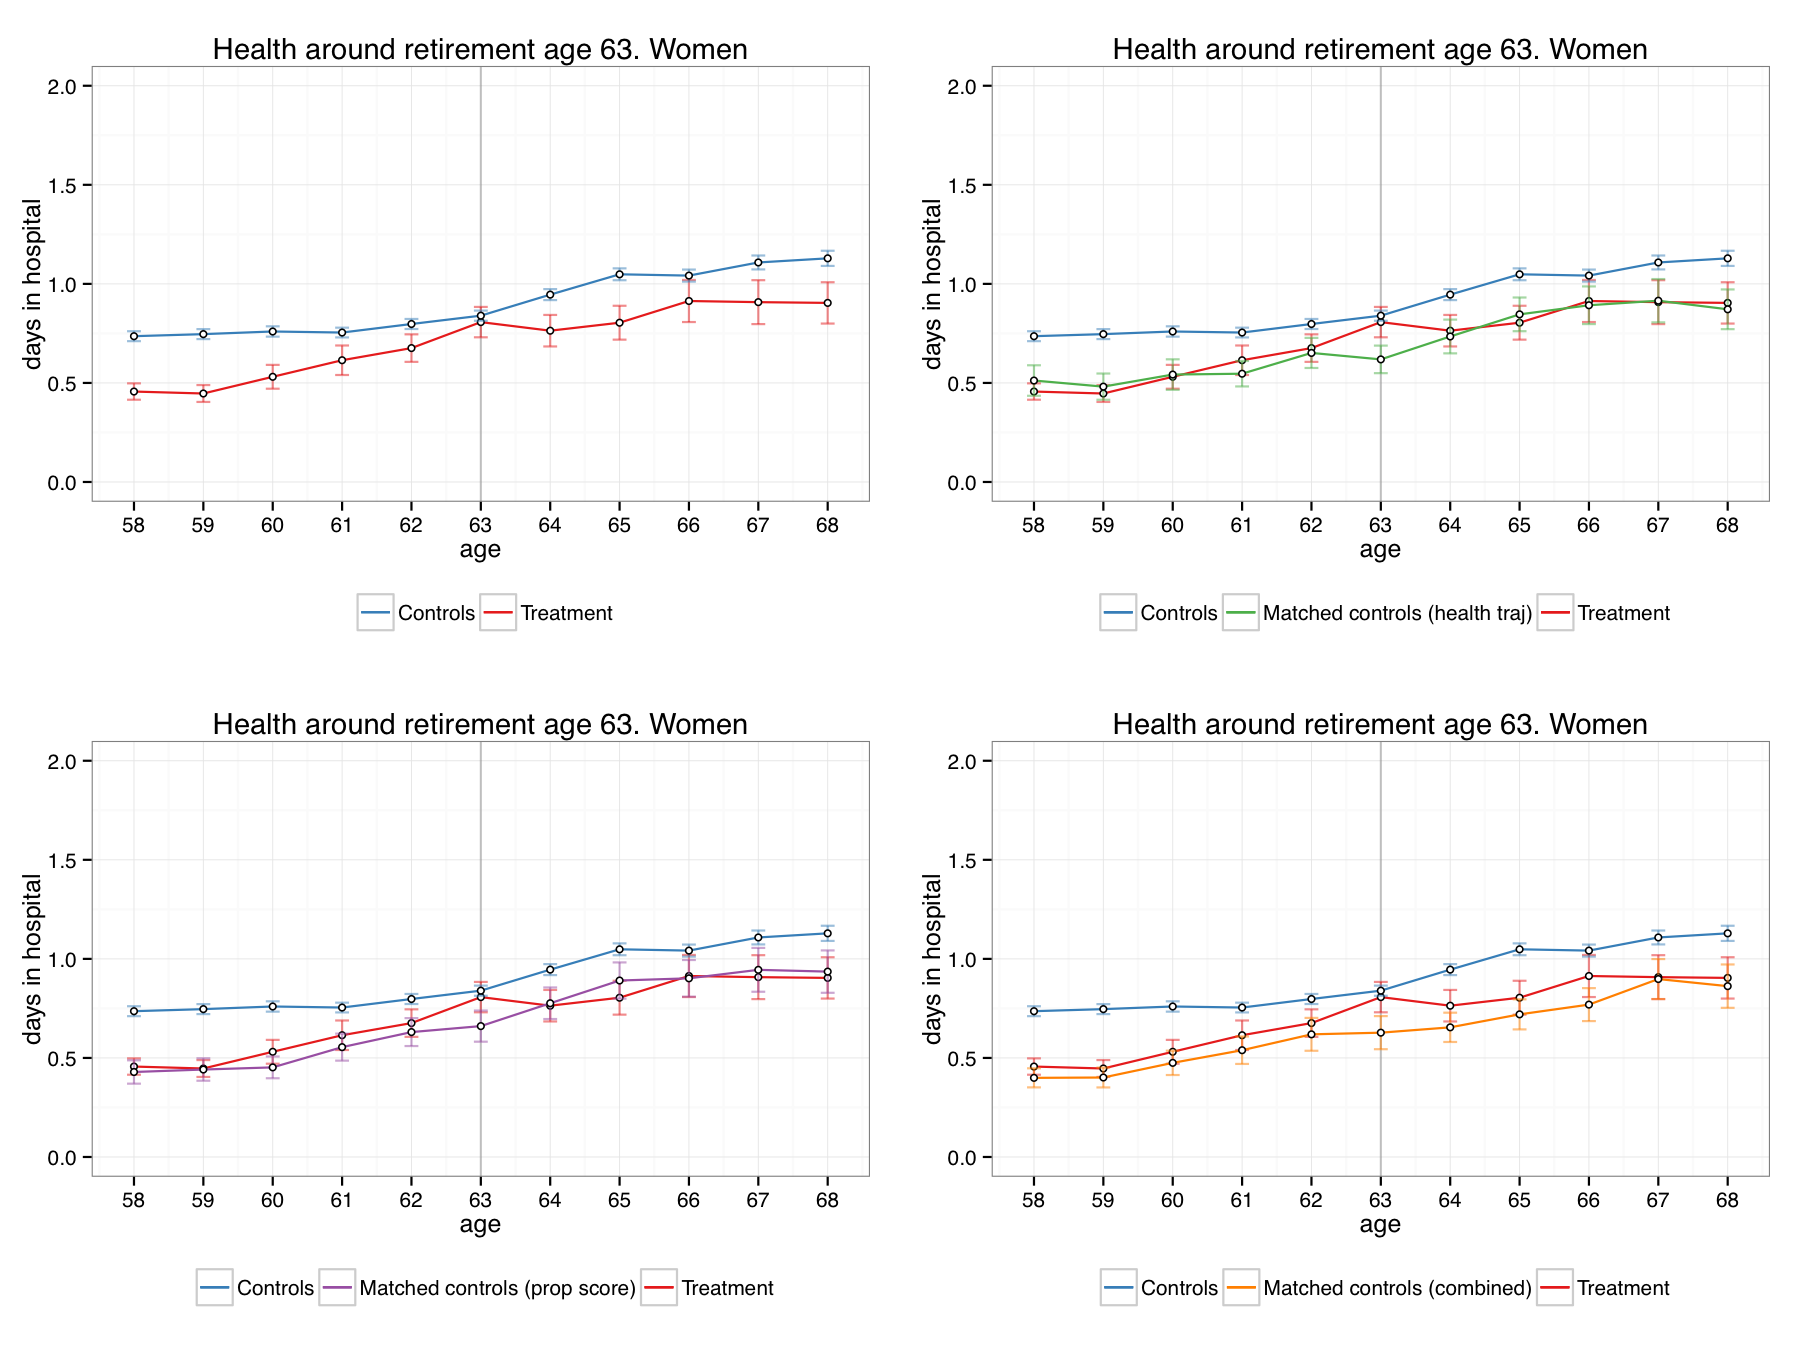
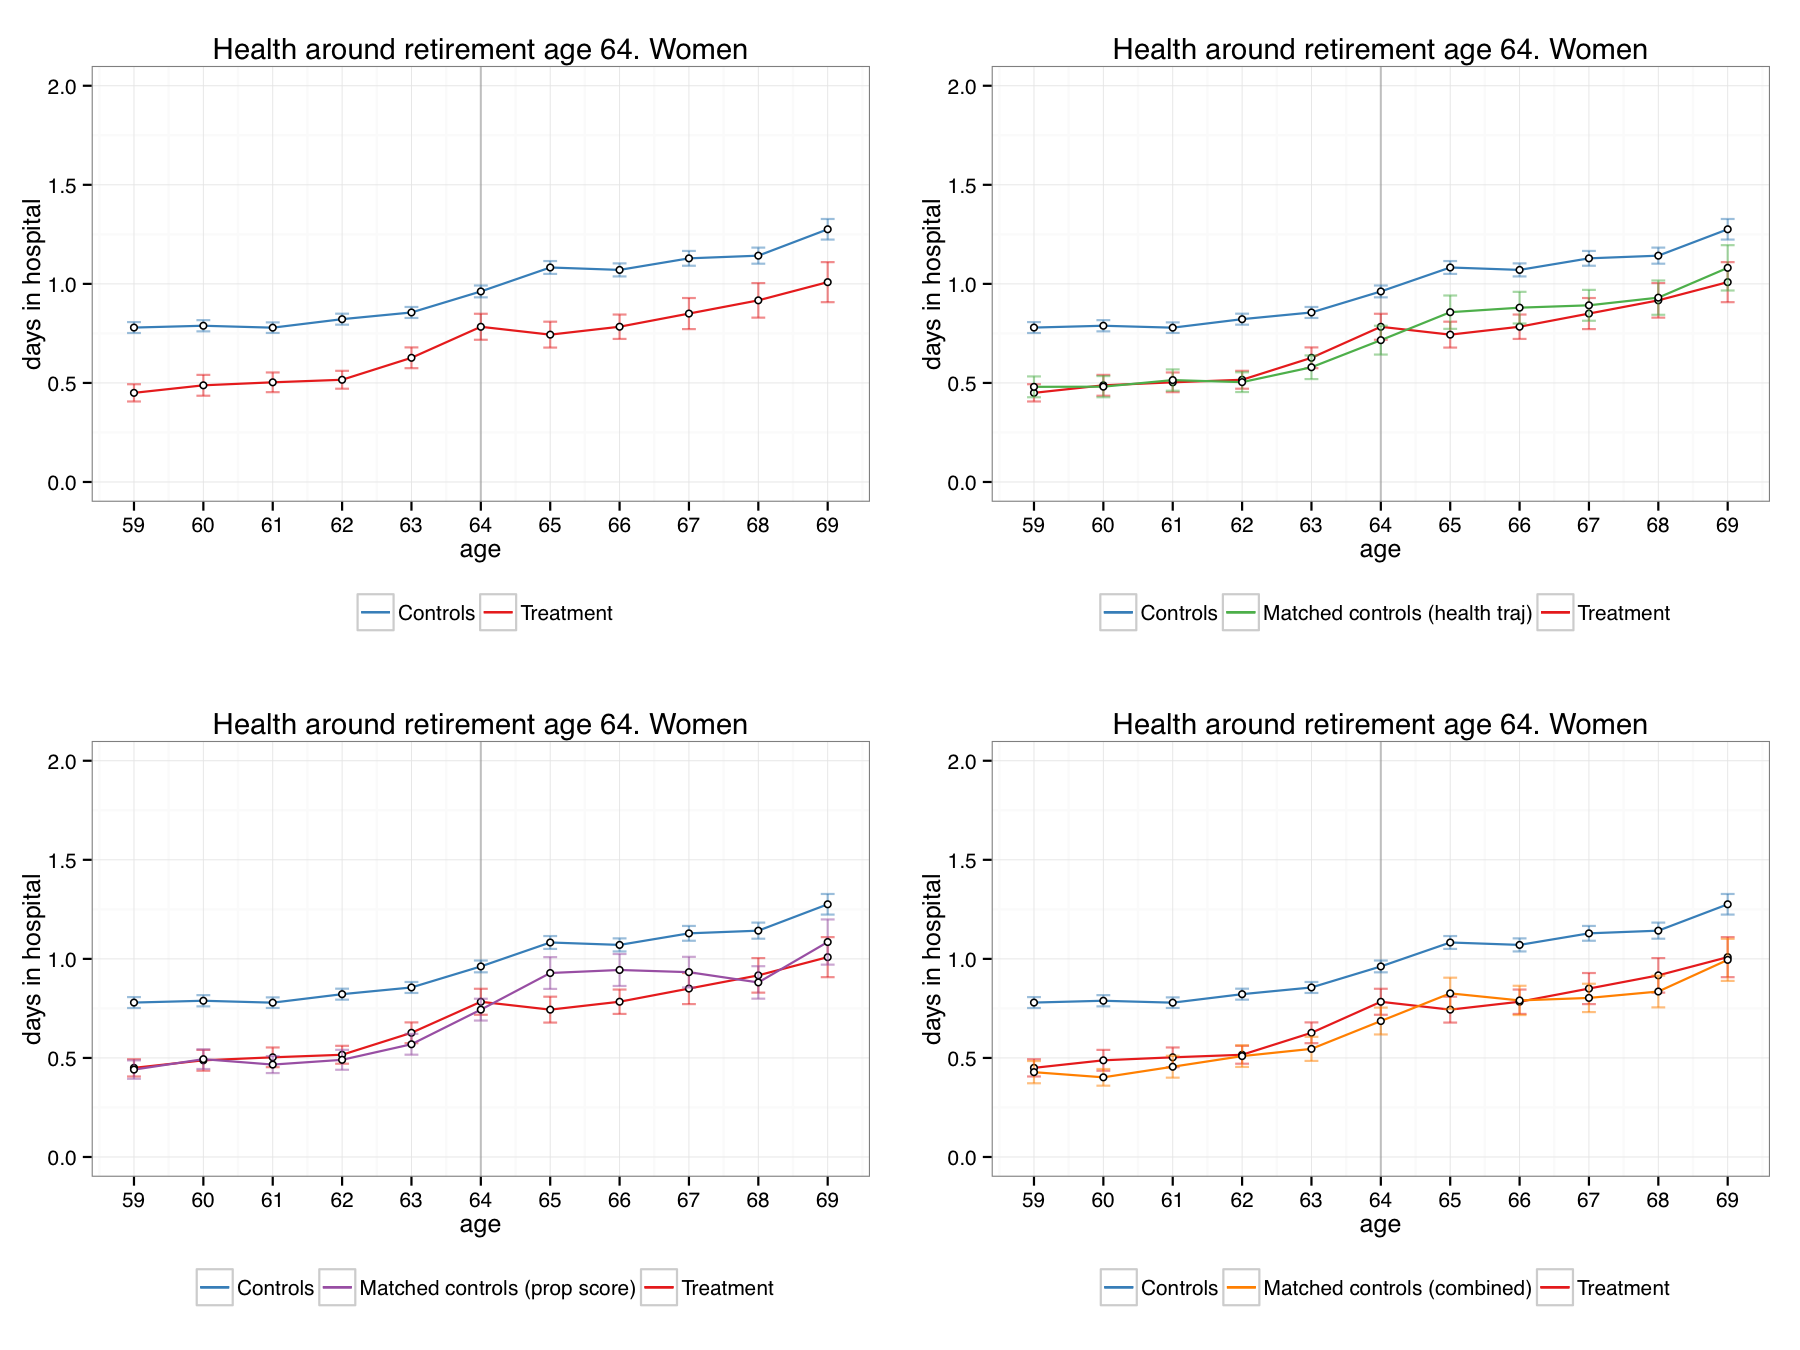
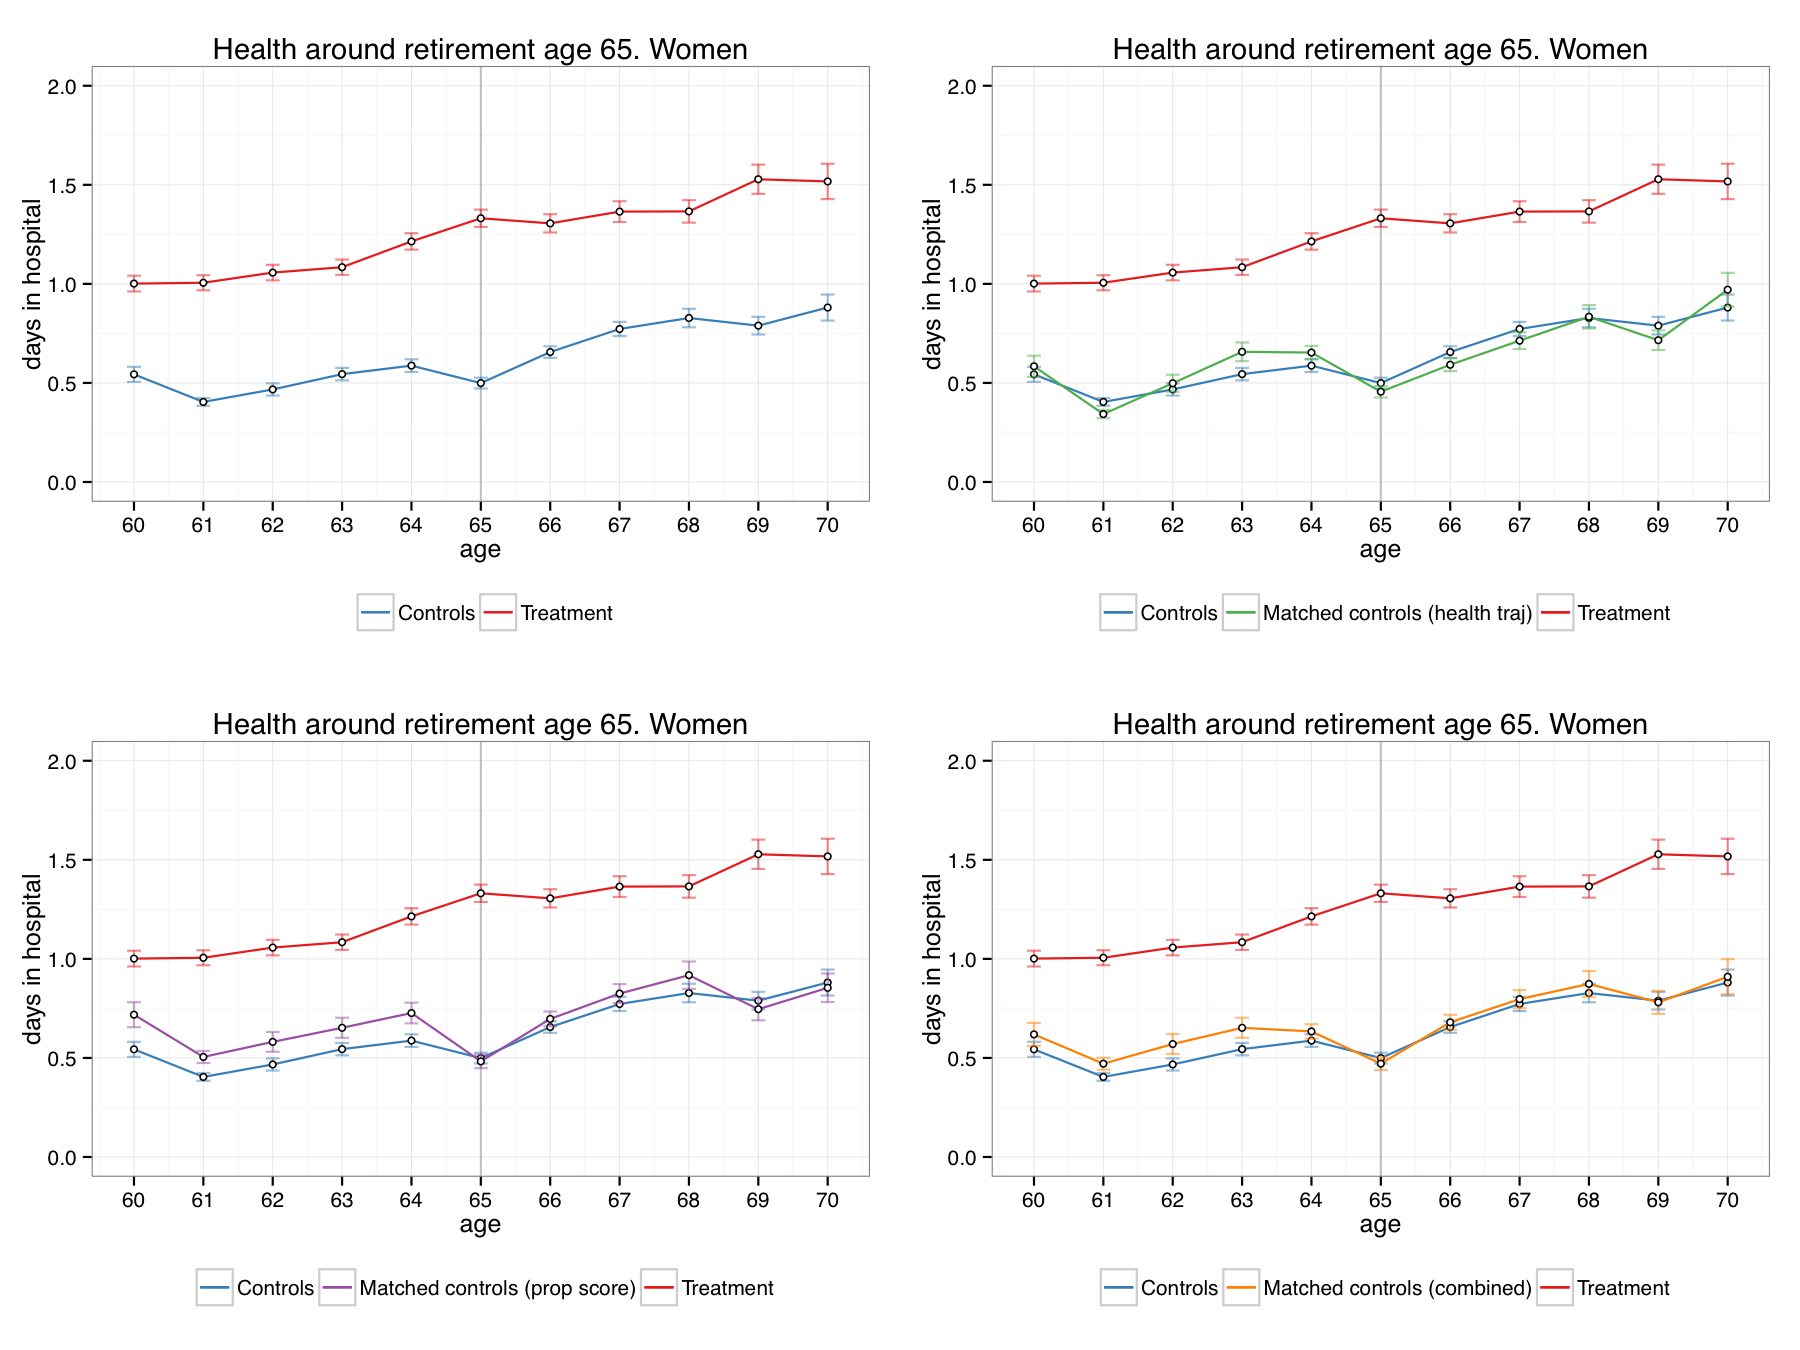
Average number od hospitalization days before and after retirement. Treatment group (red line) refers to those retiring at age x, control group (blue line) refers to those retiring after age x, matched controls (green, purple and orange lines) refers to matched individuals under different matching strategies
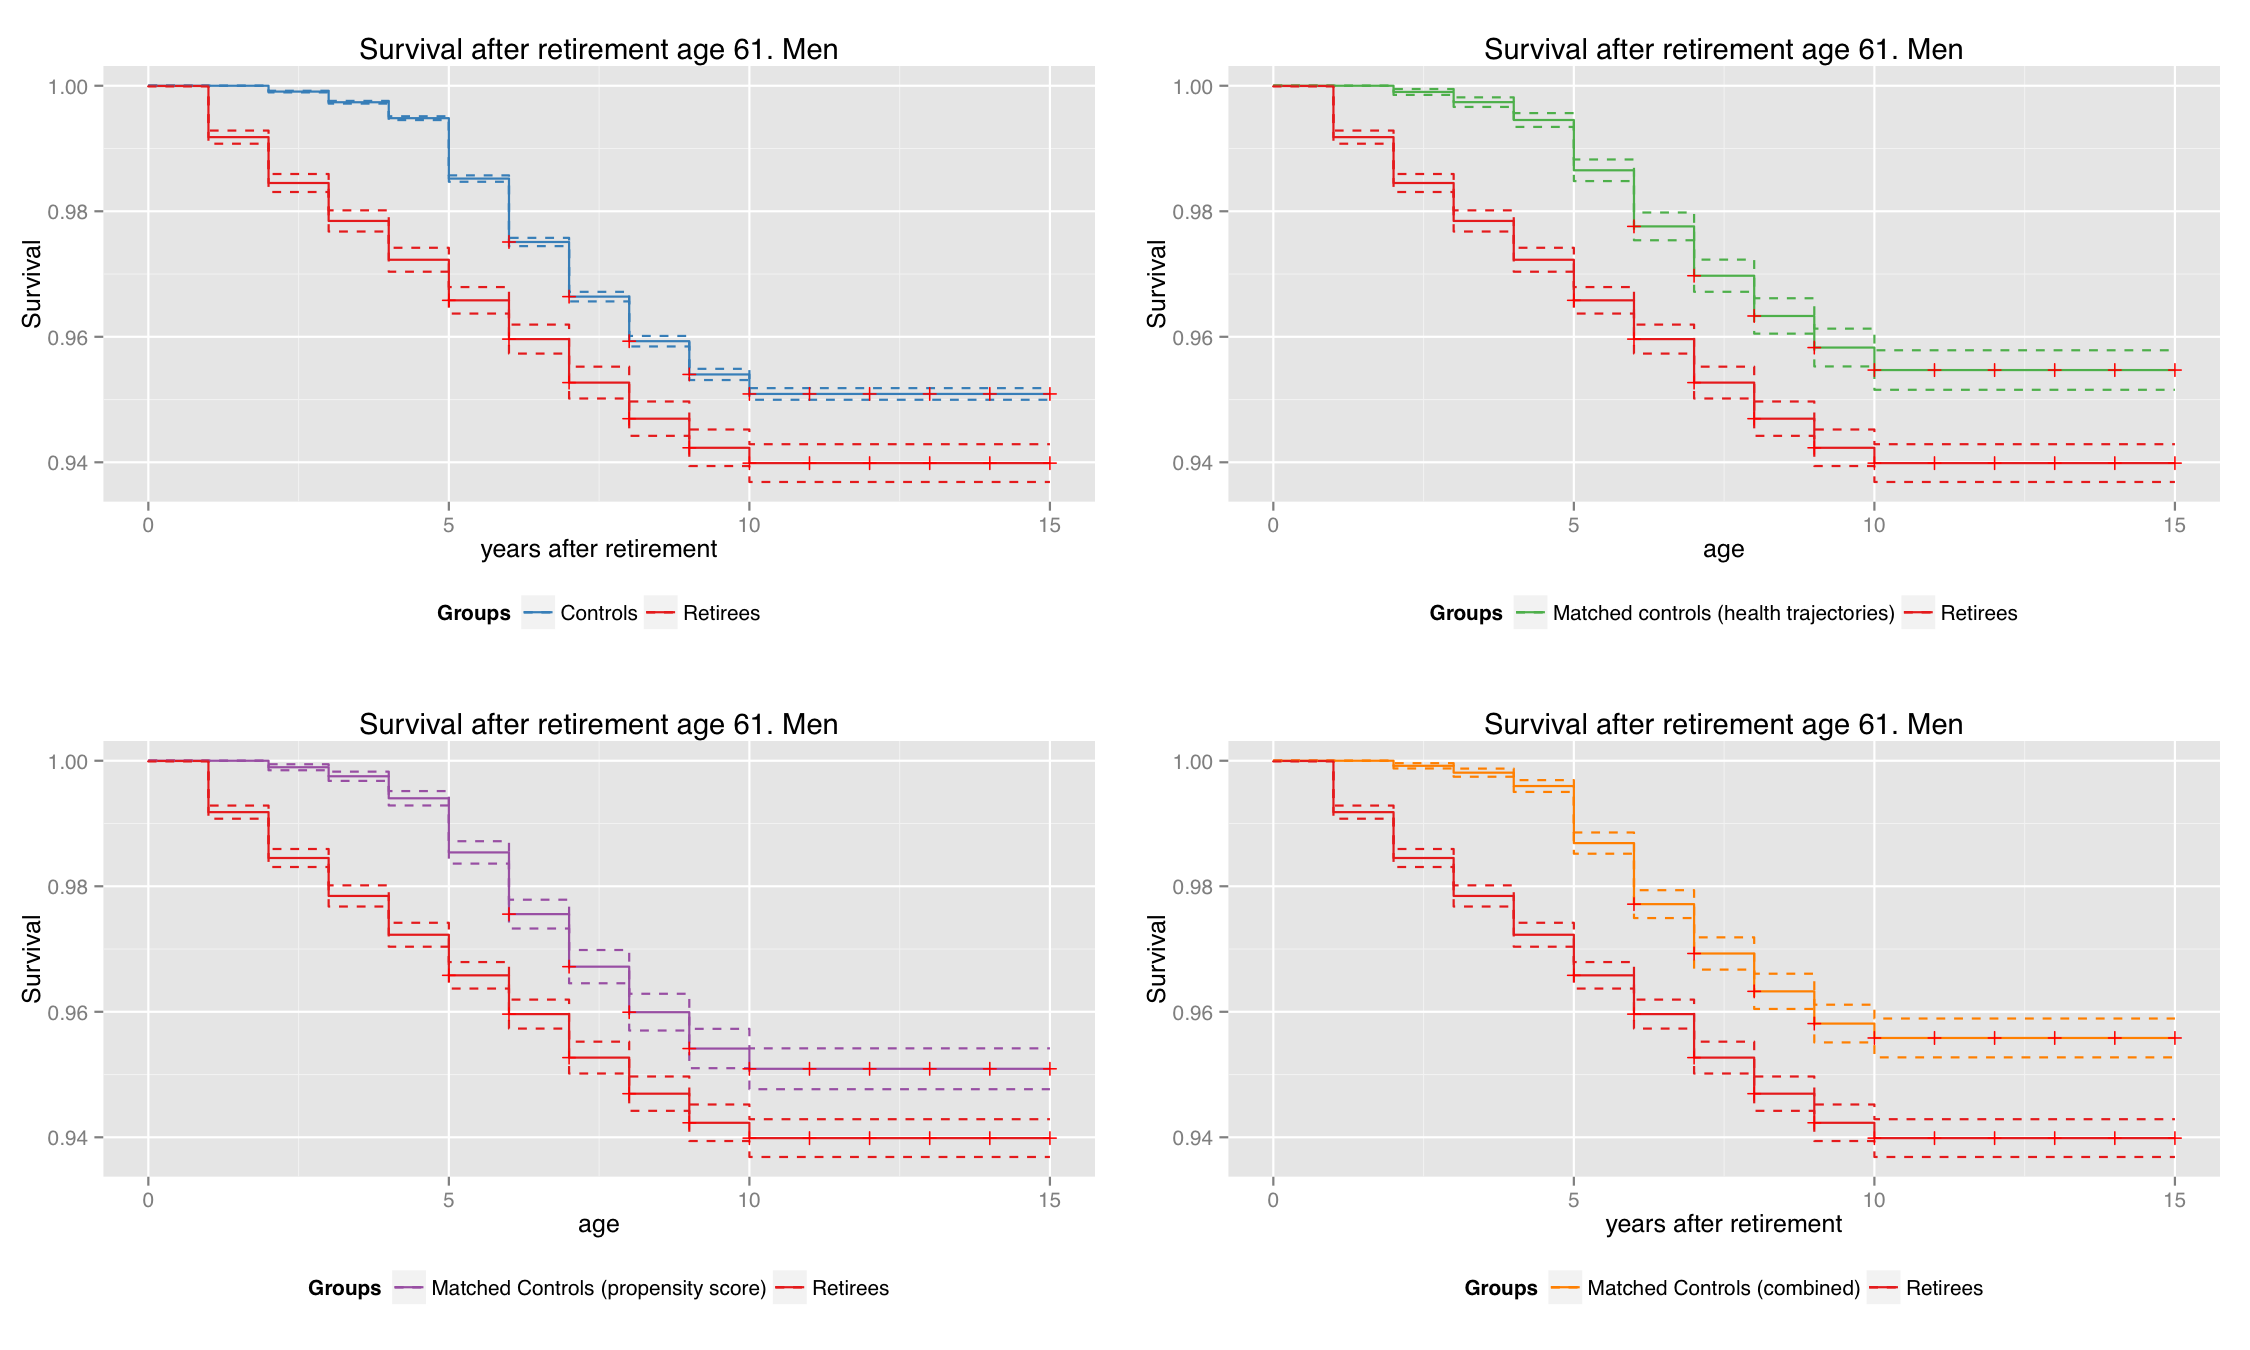
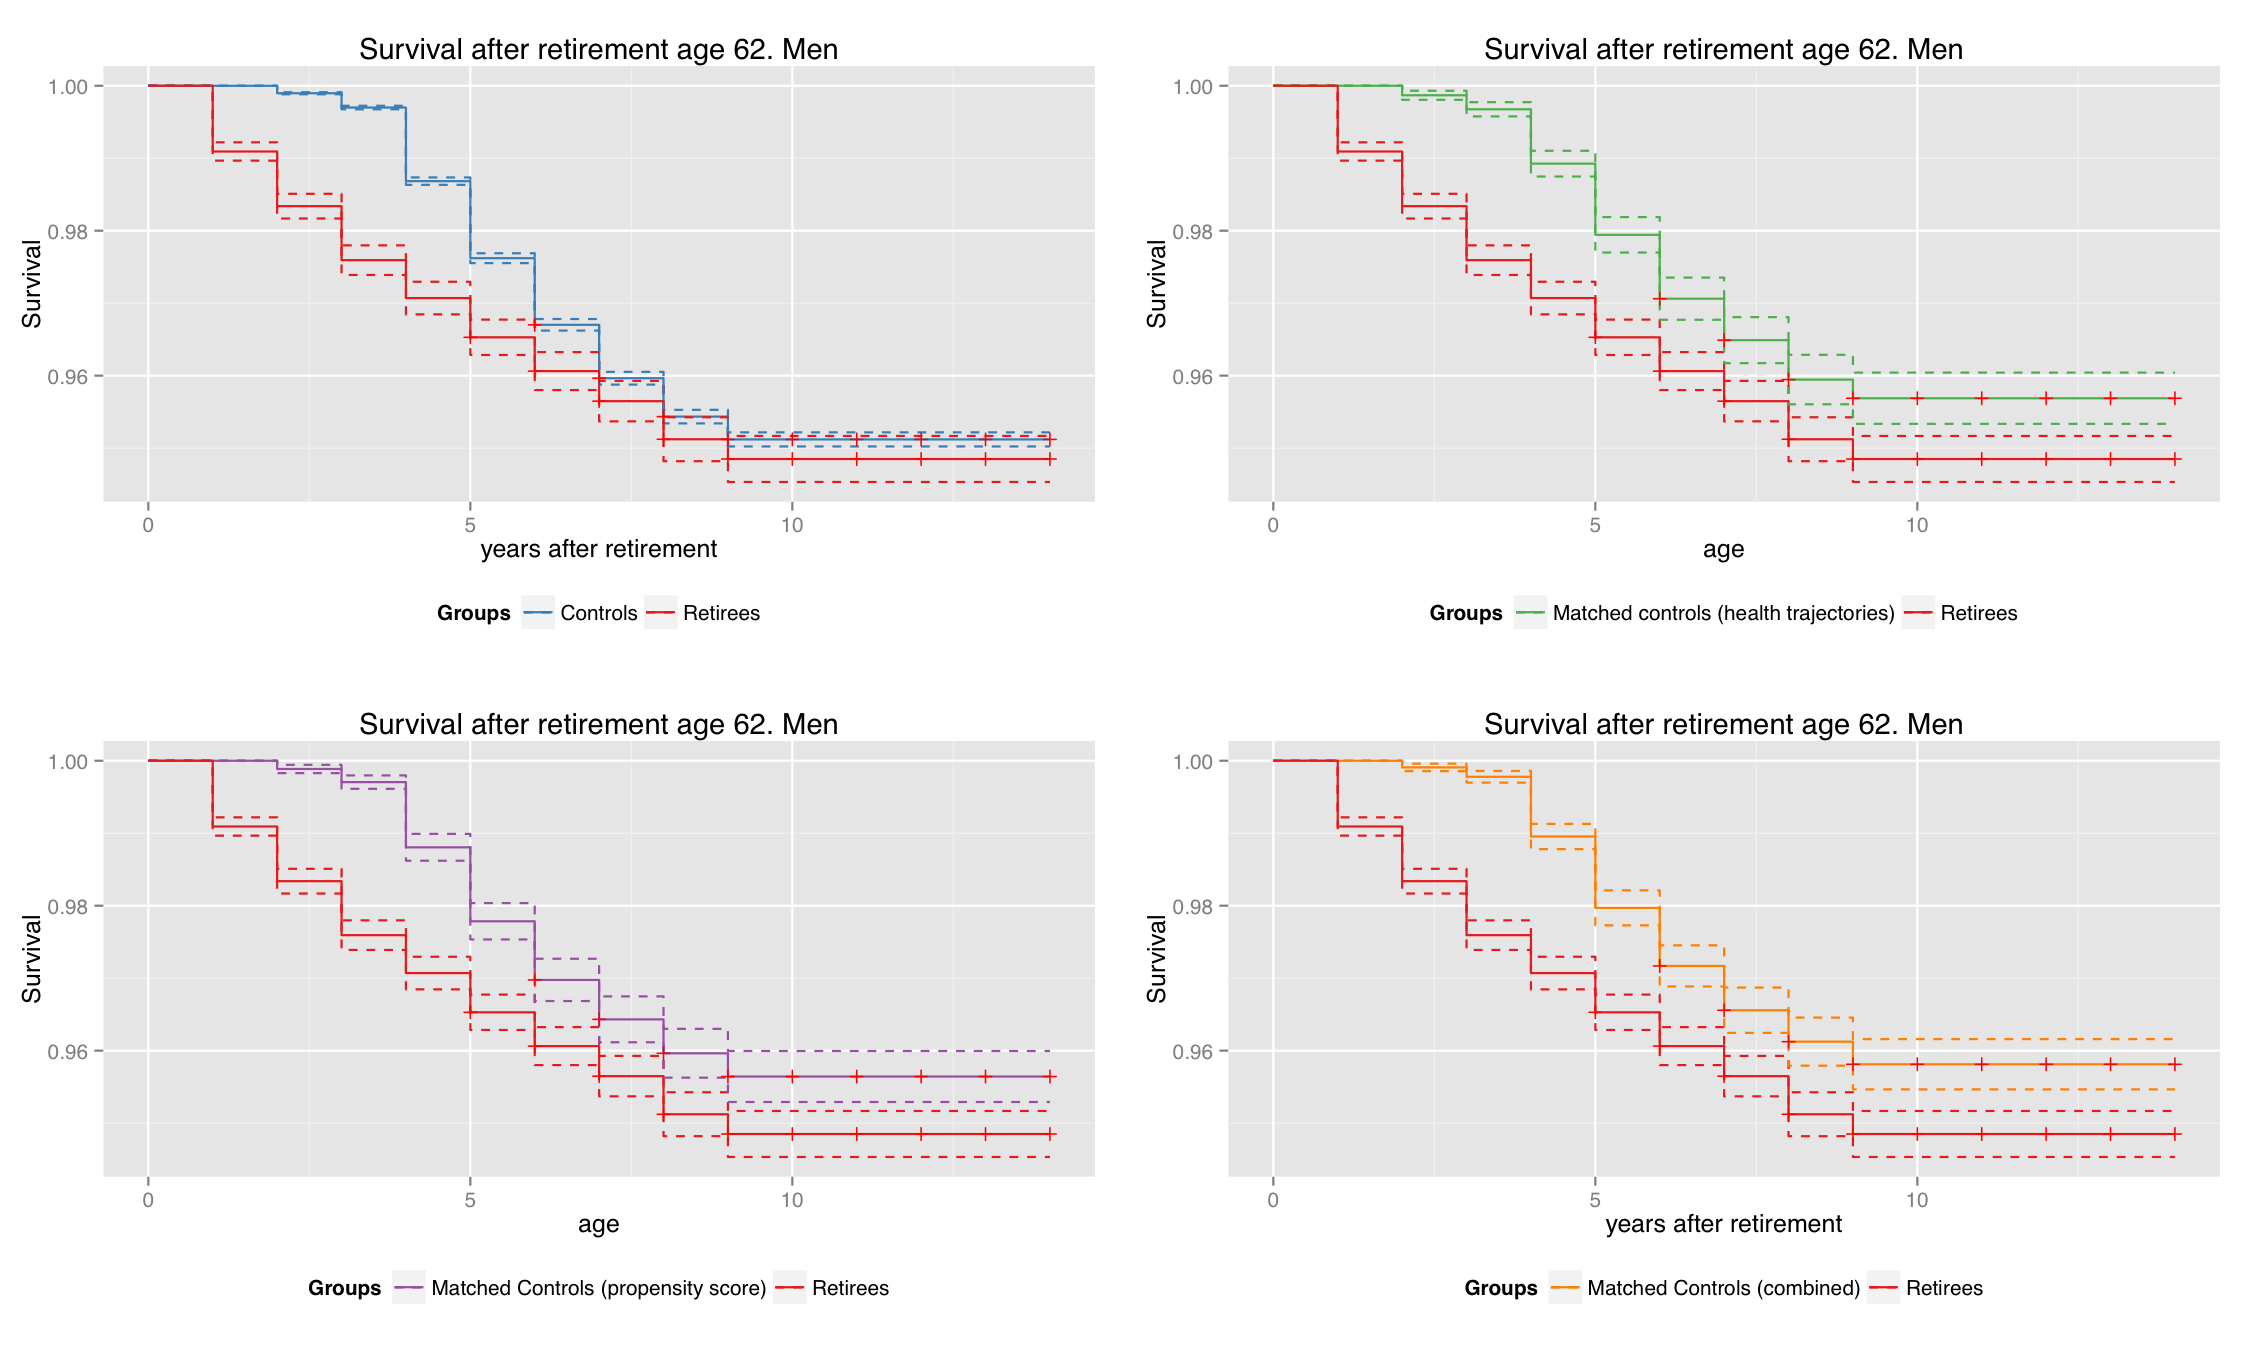
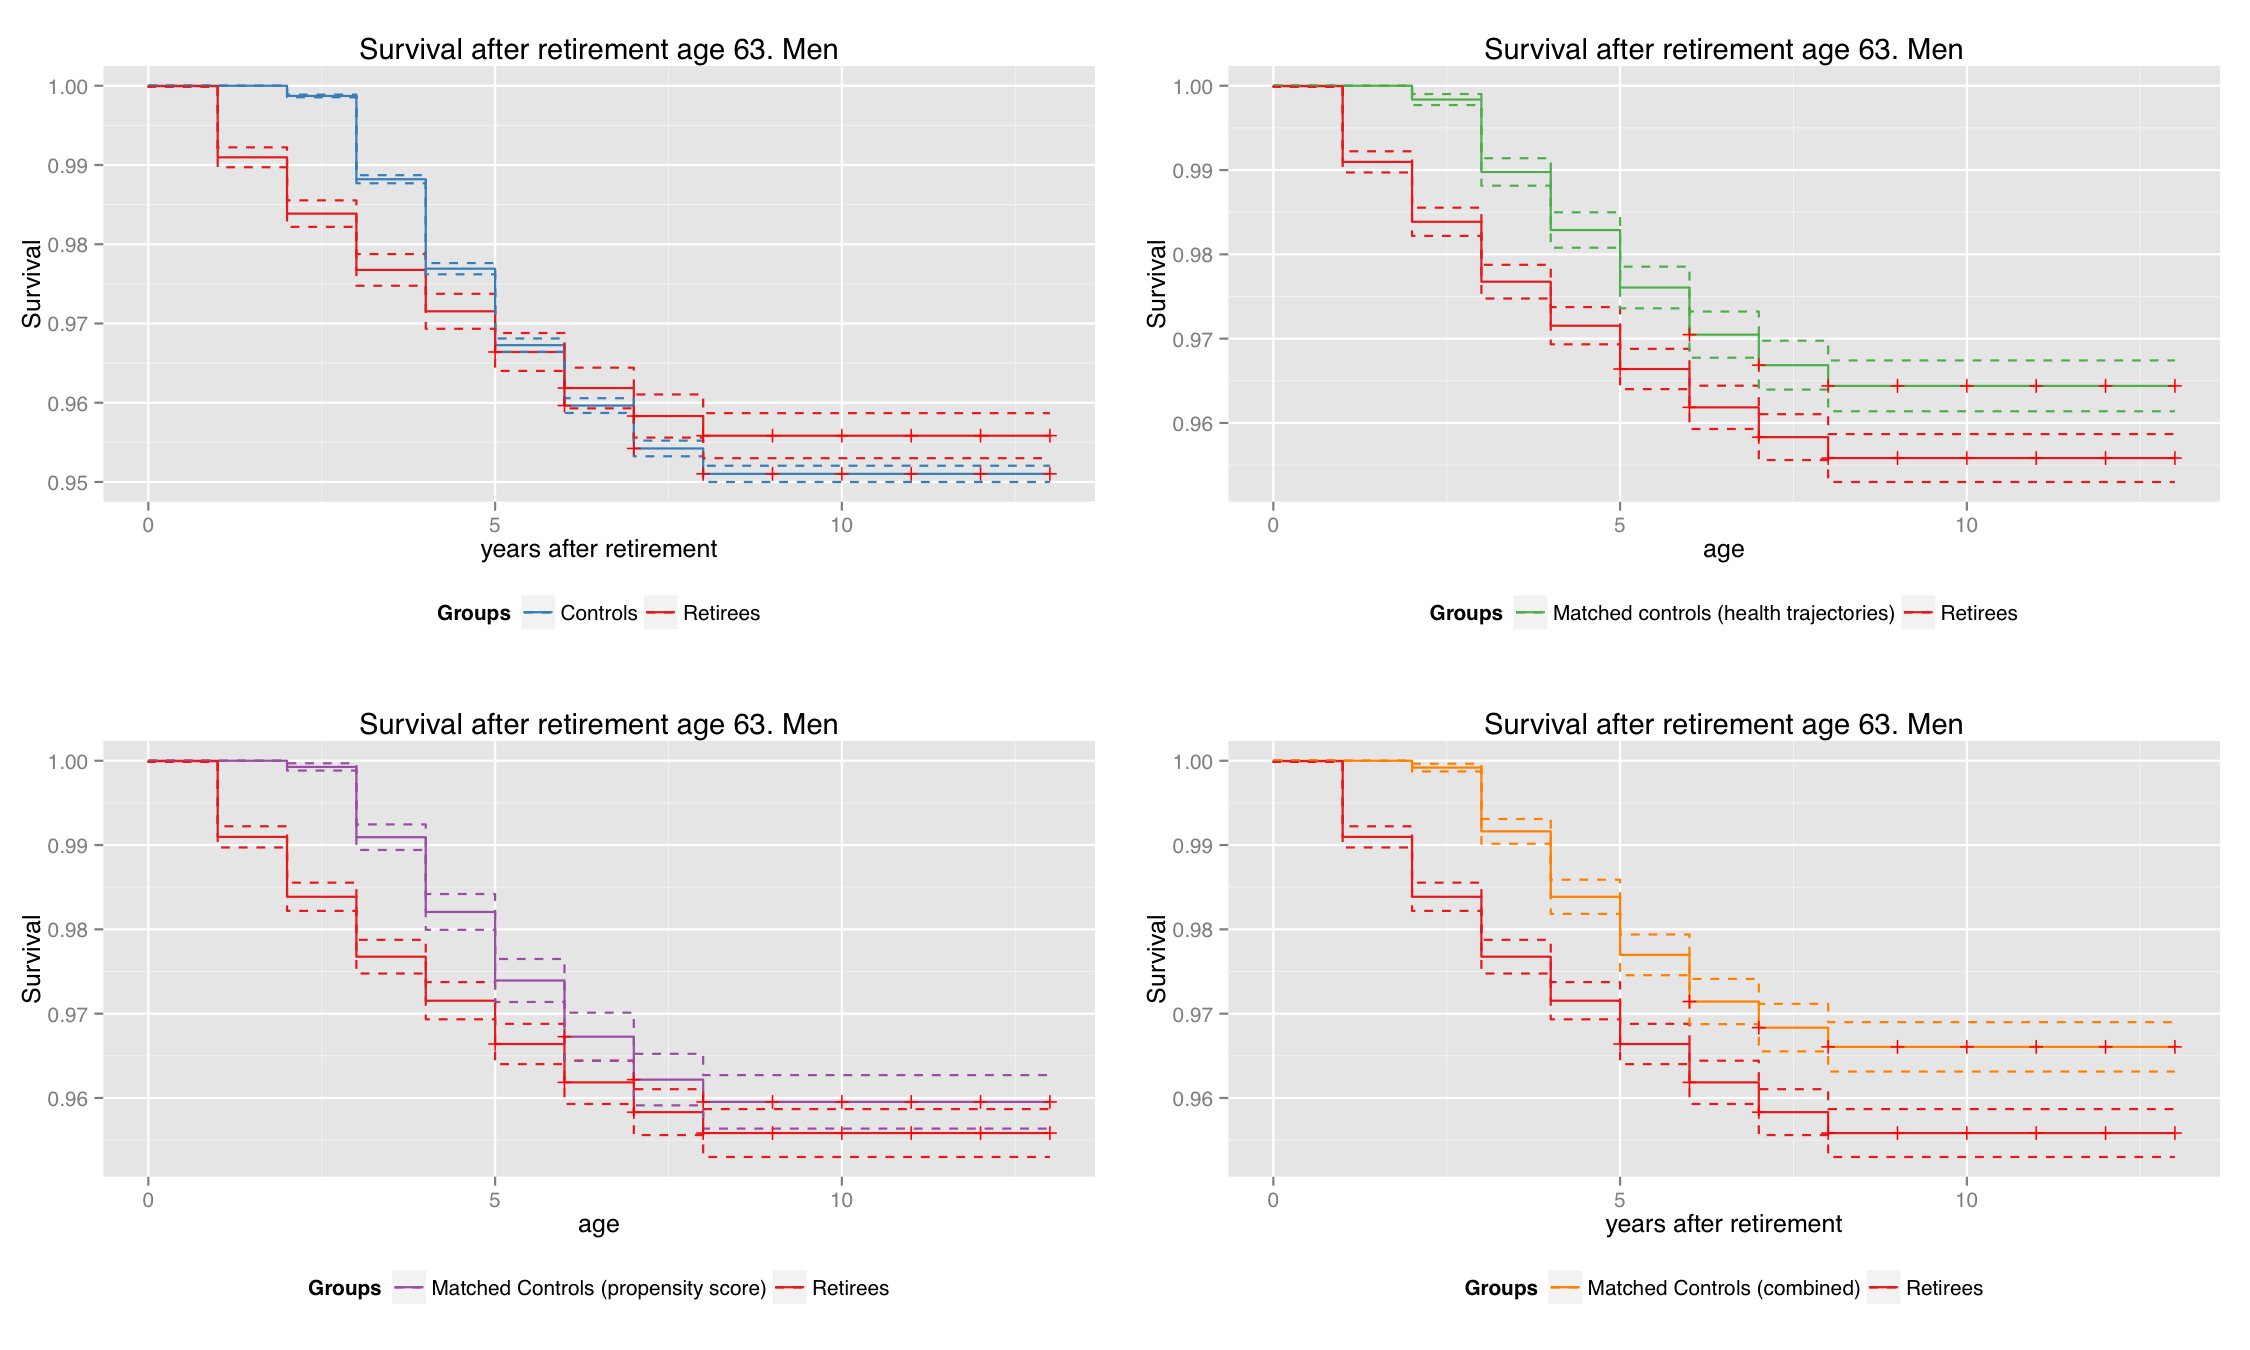
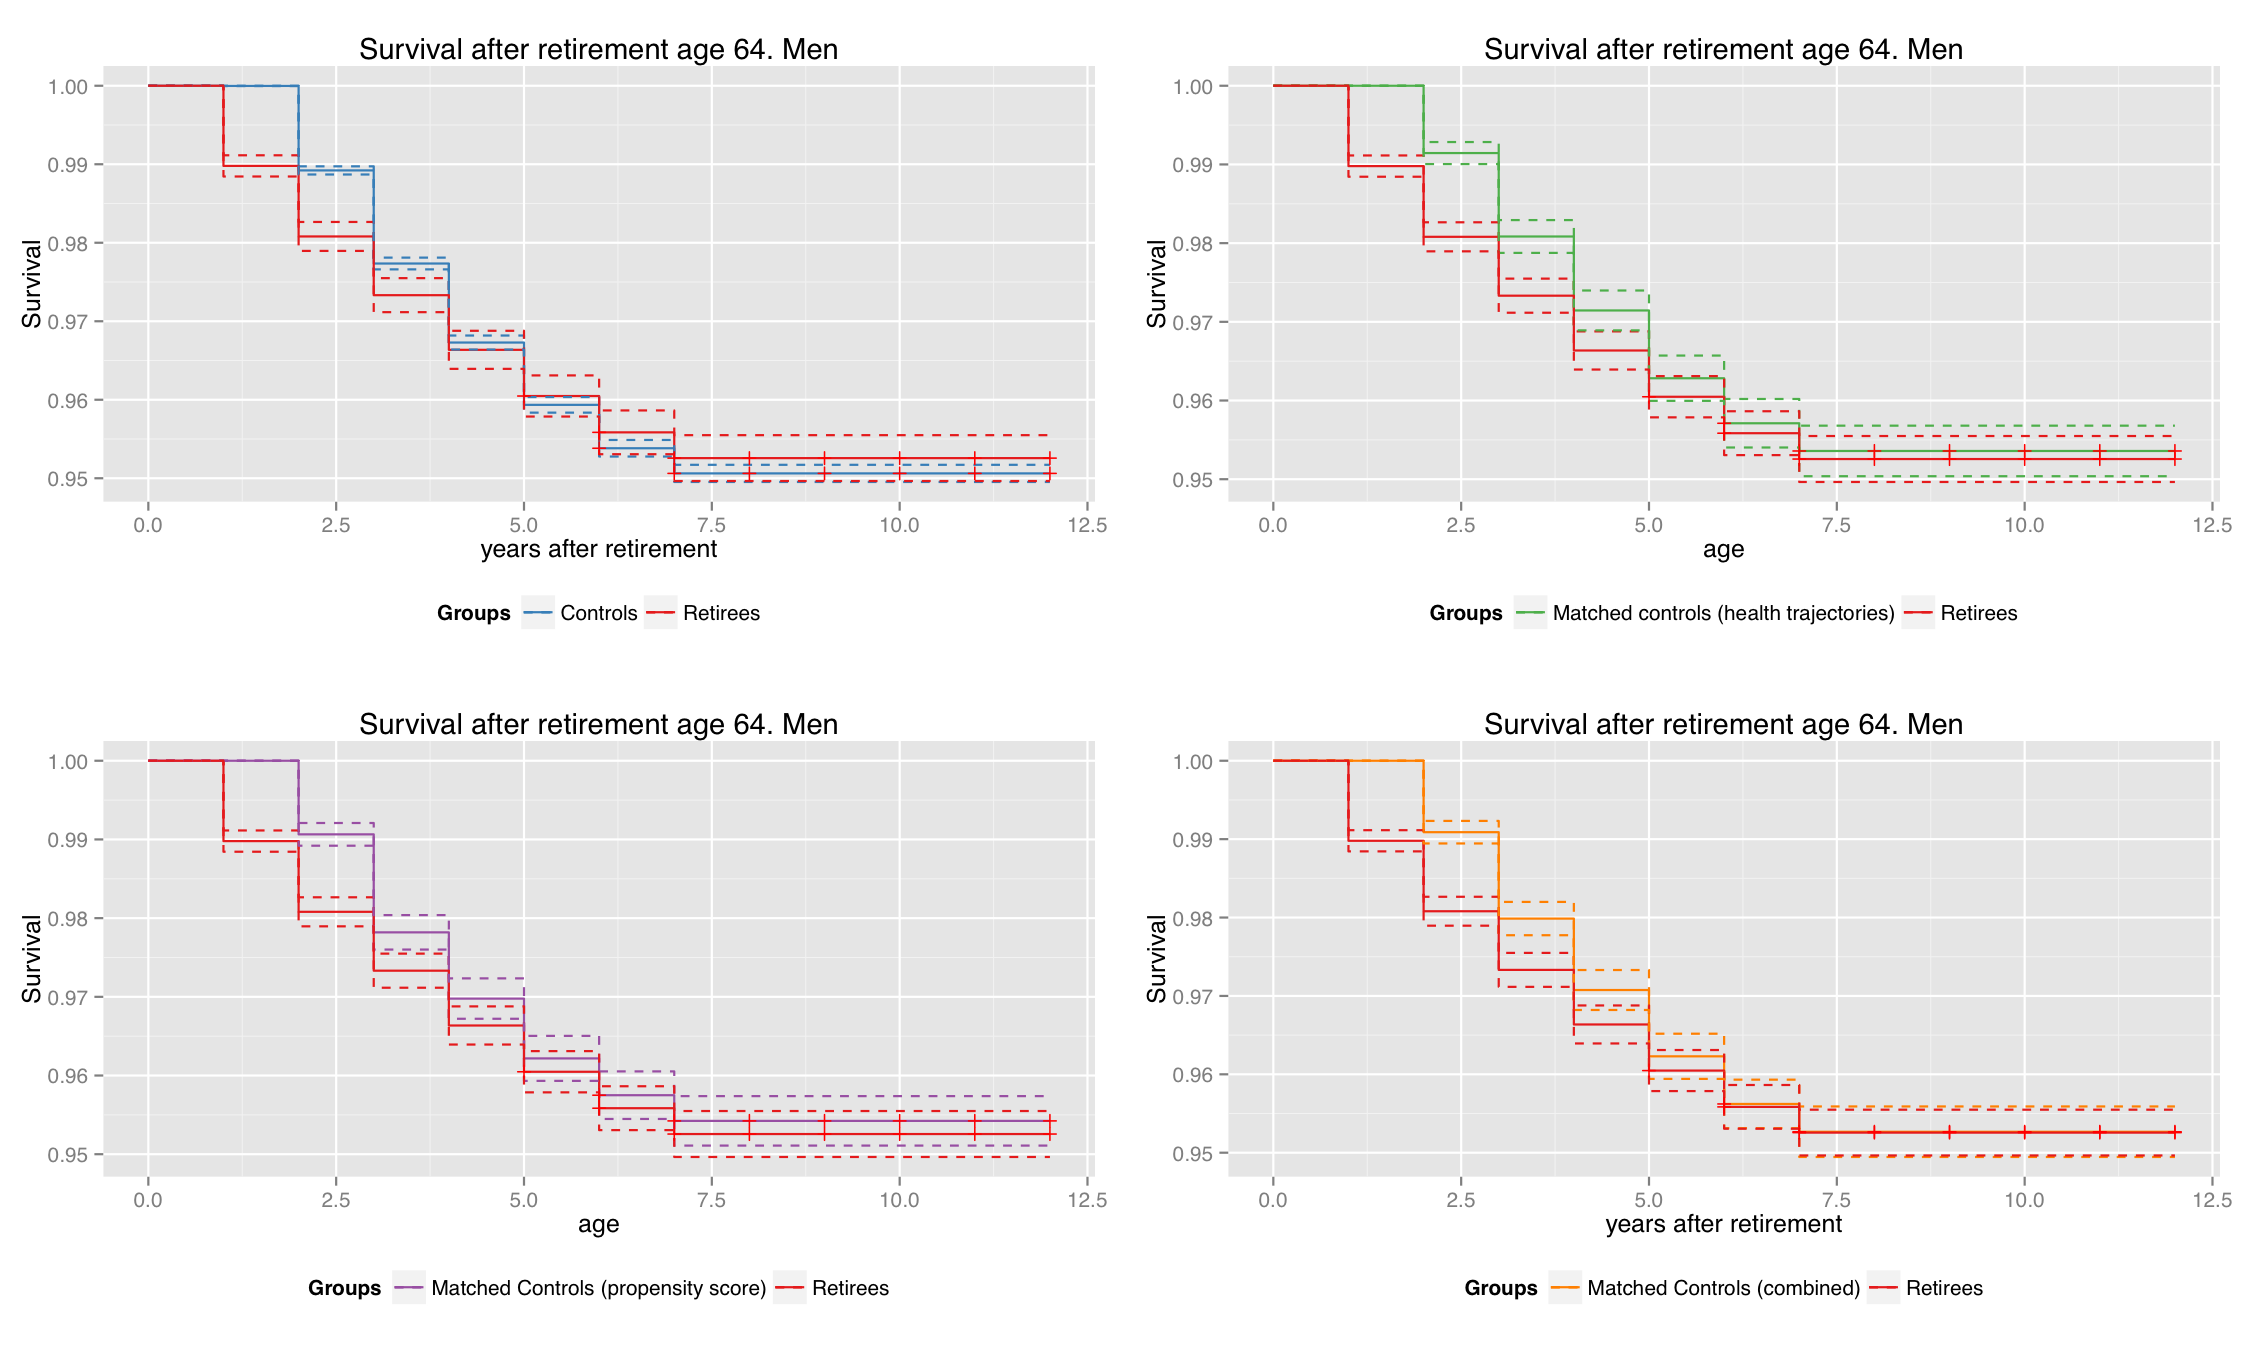
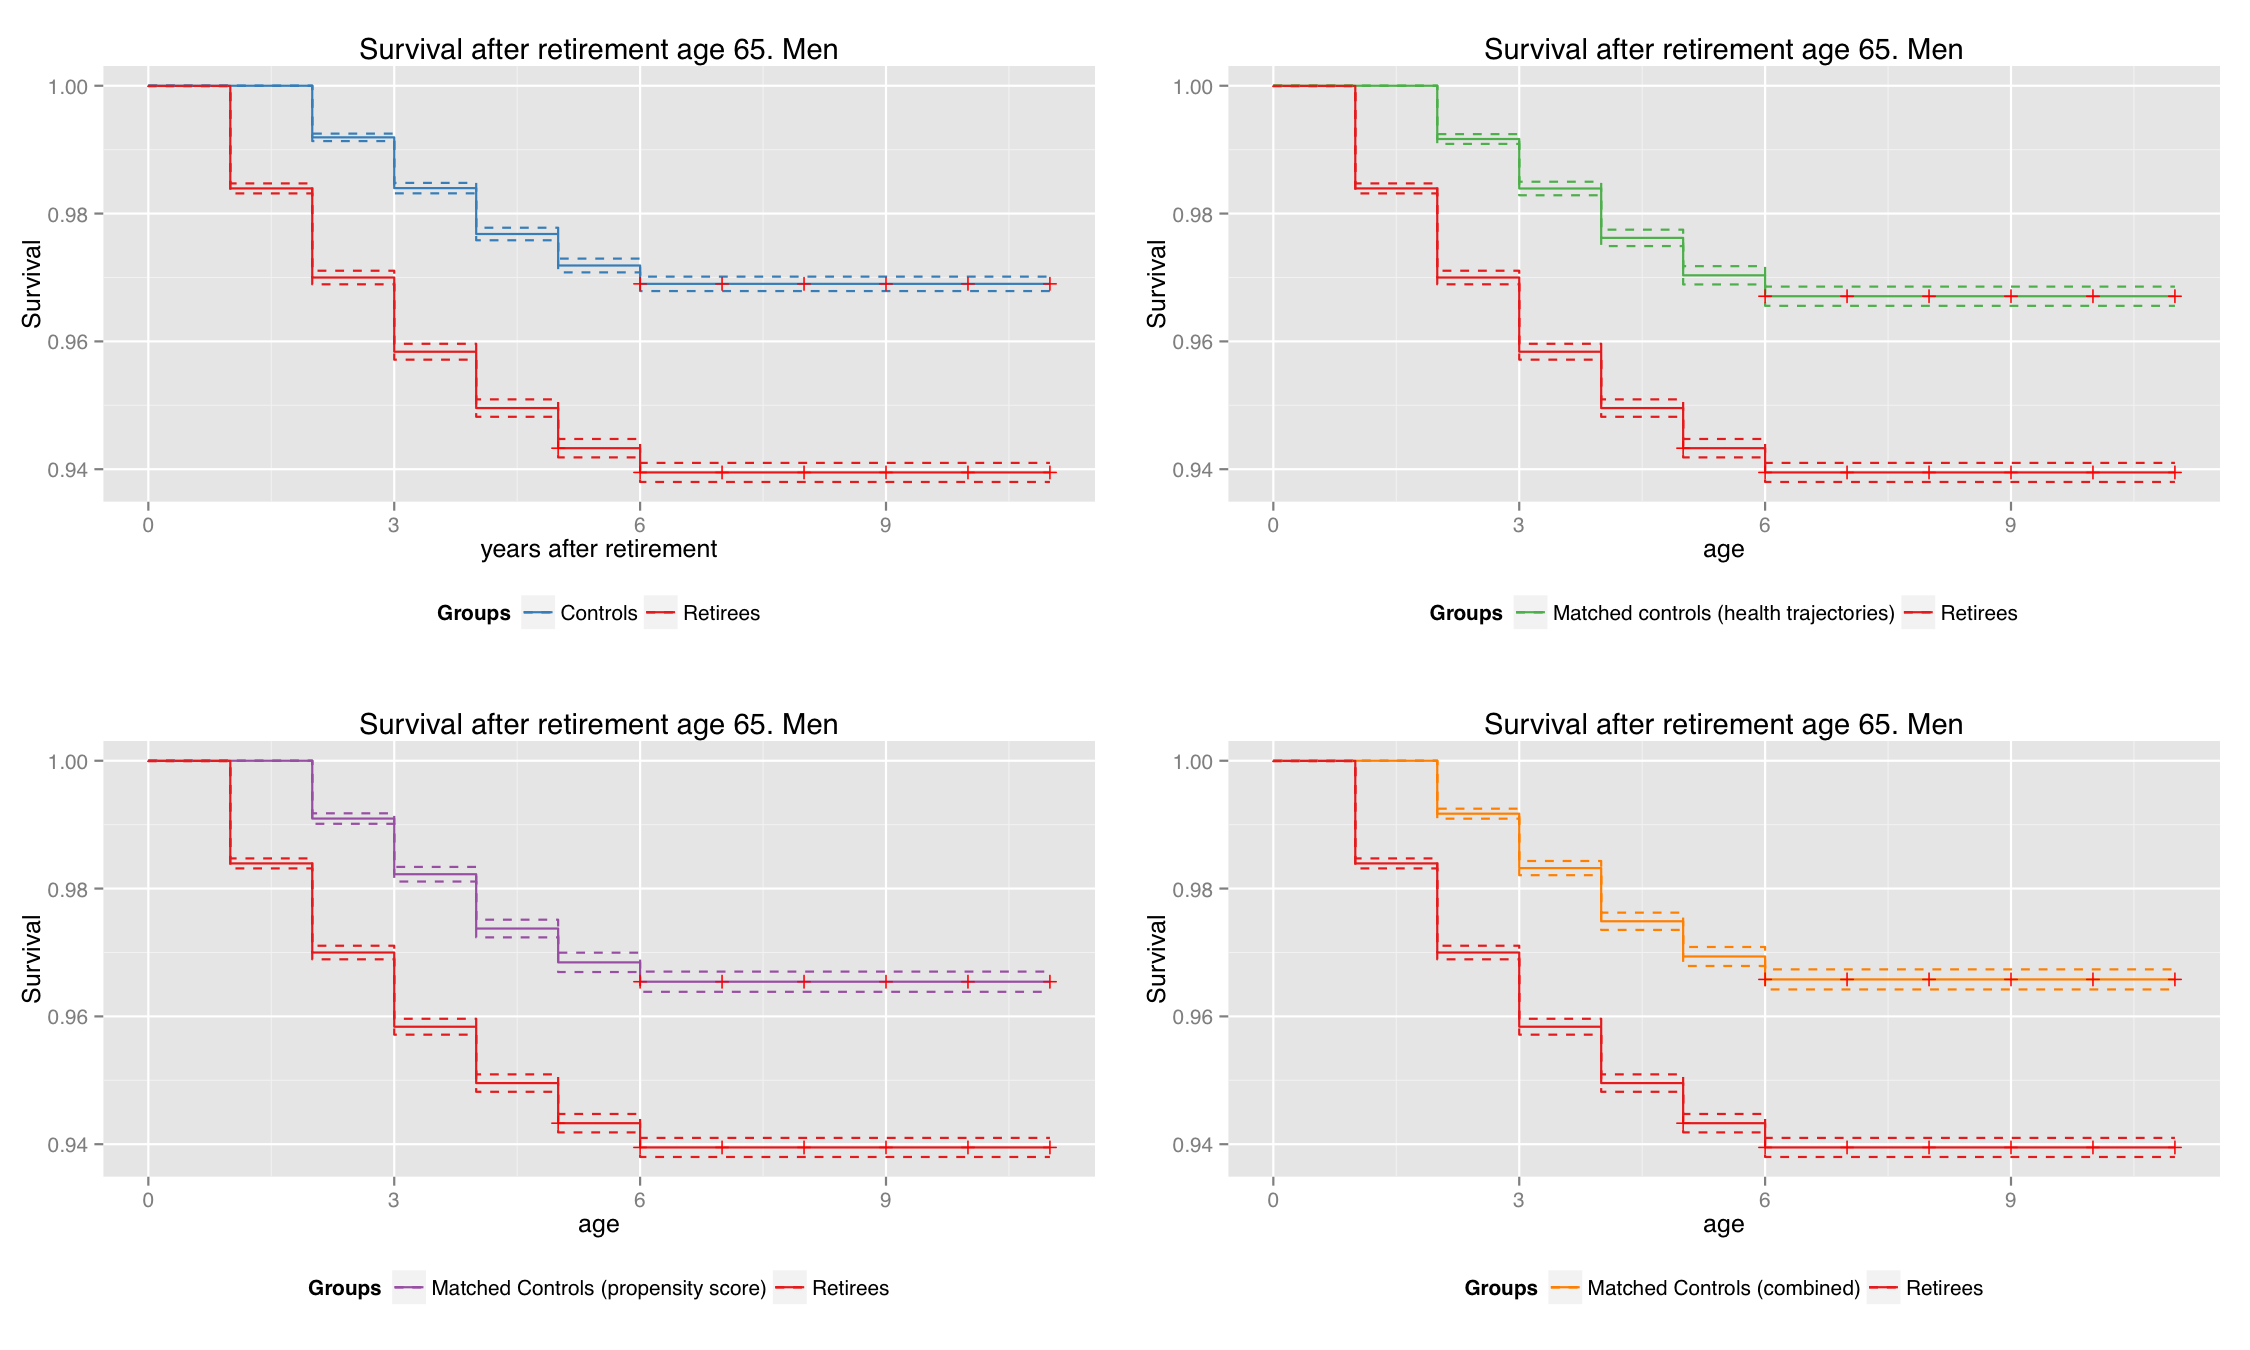
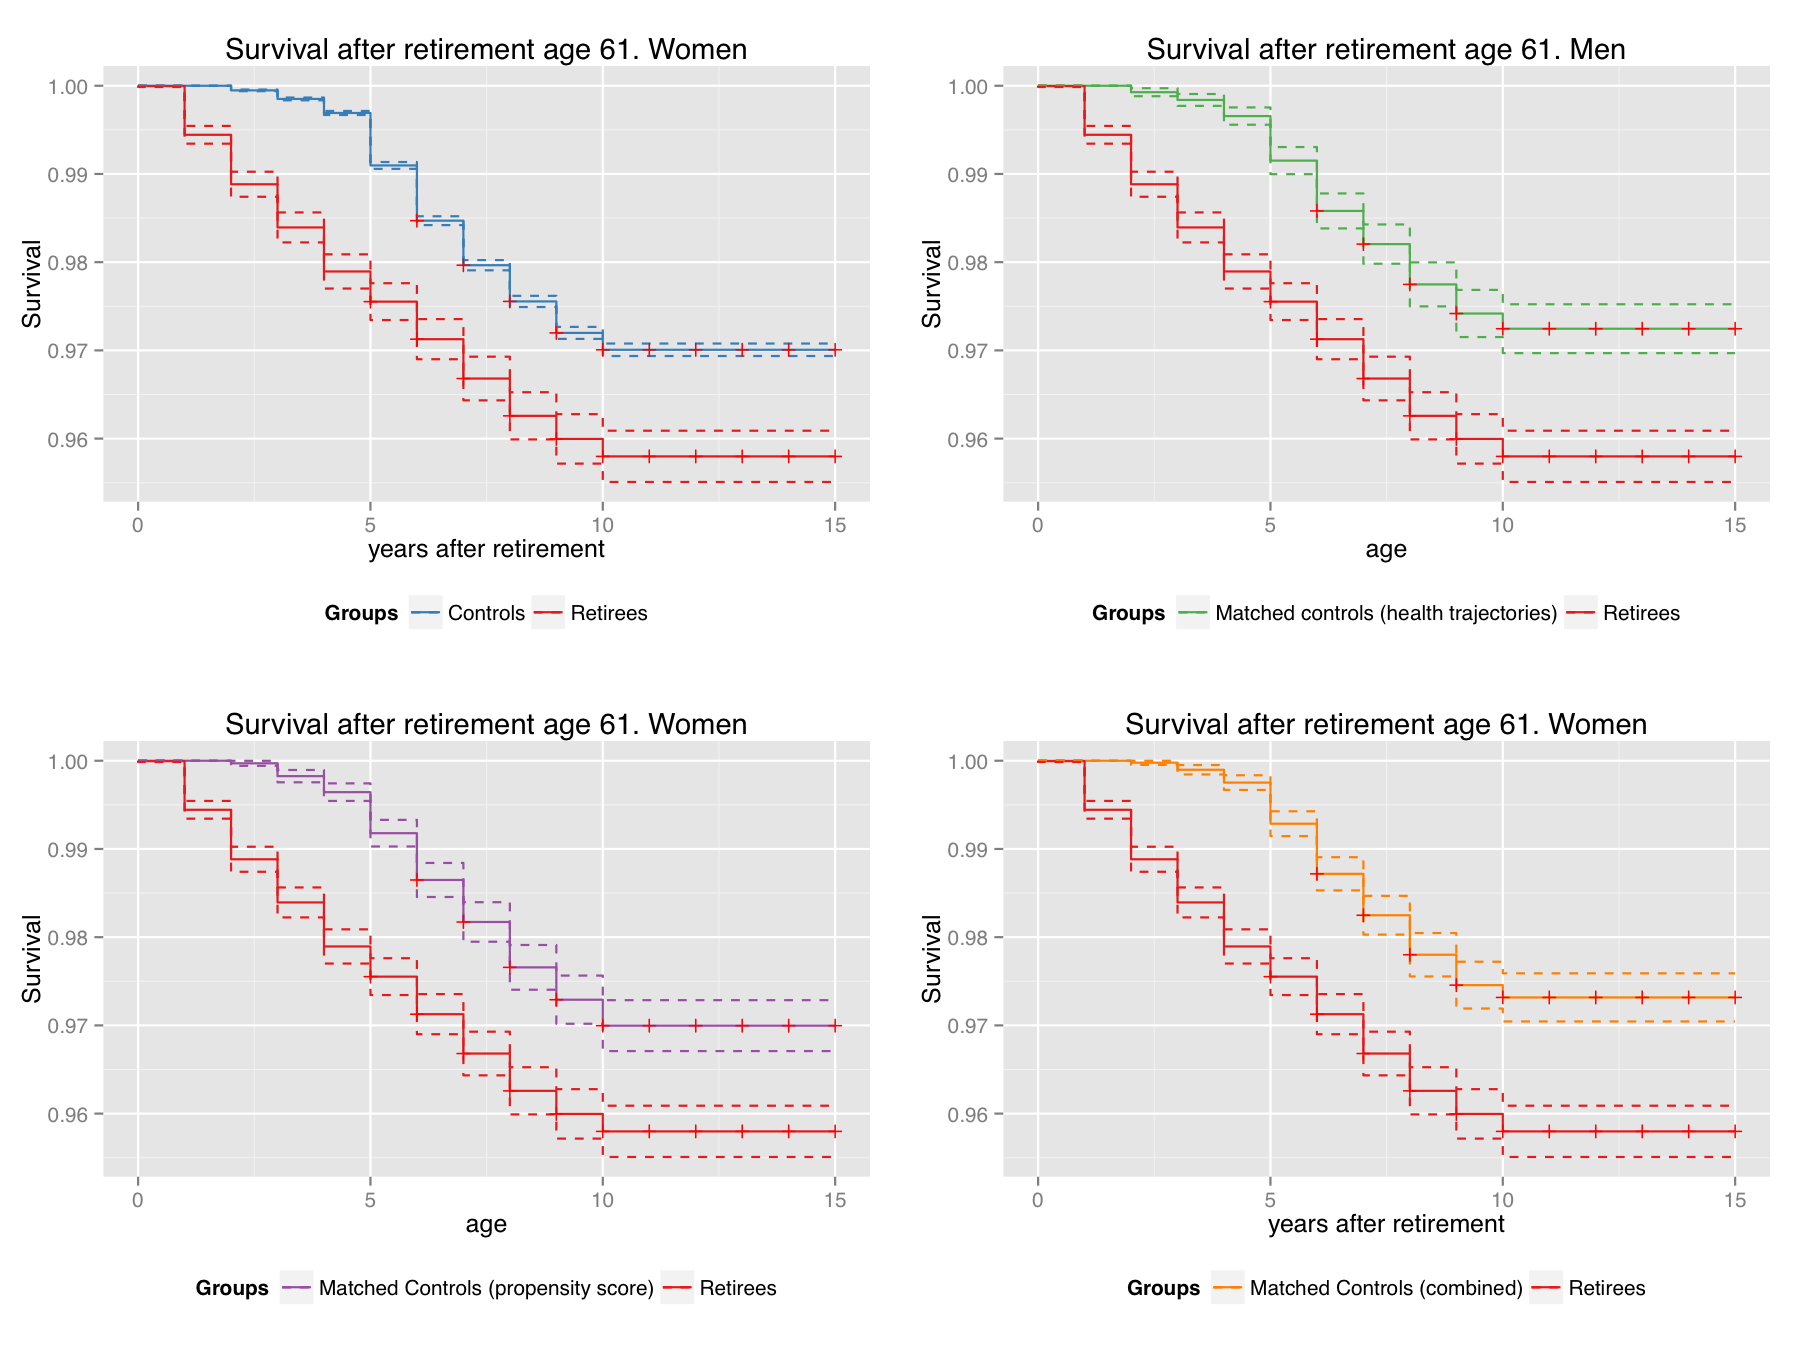
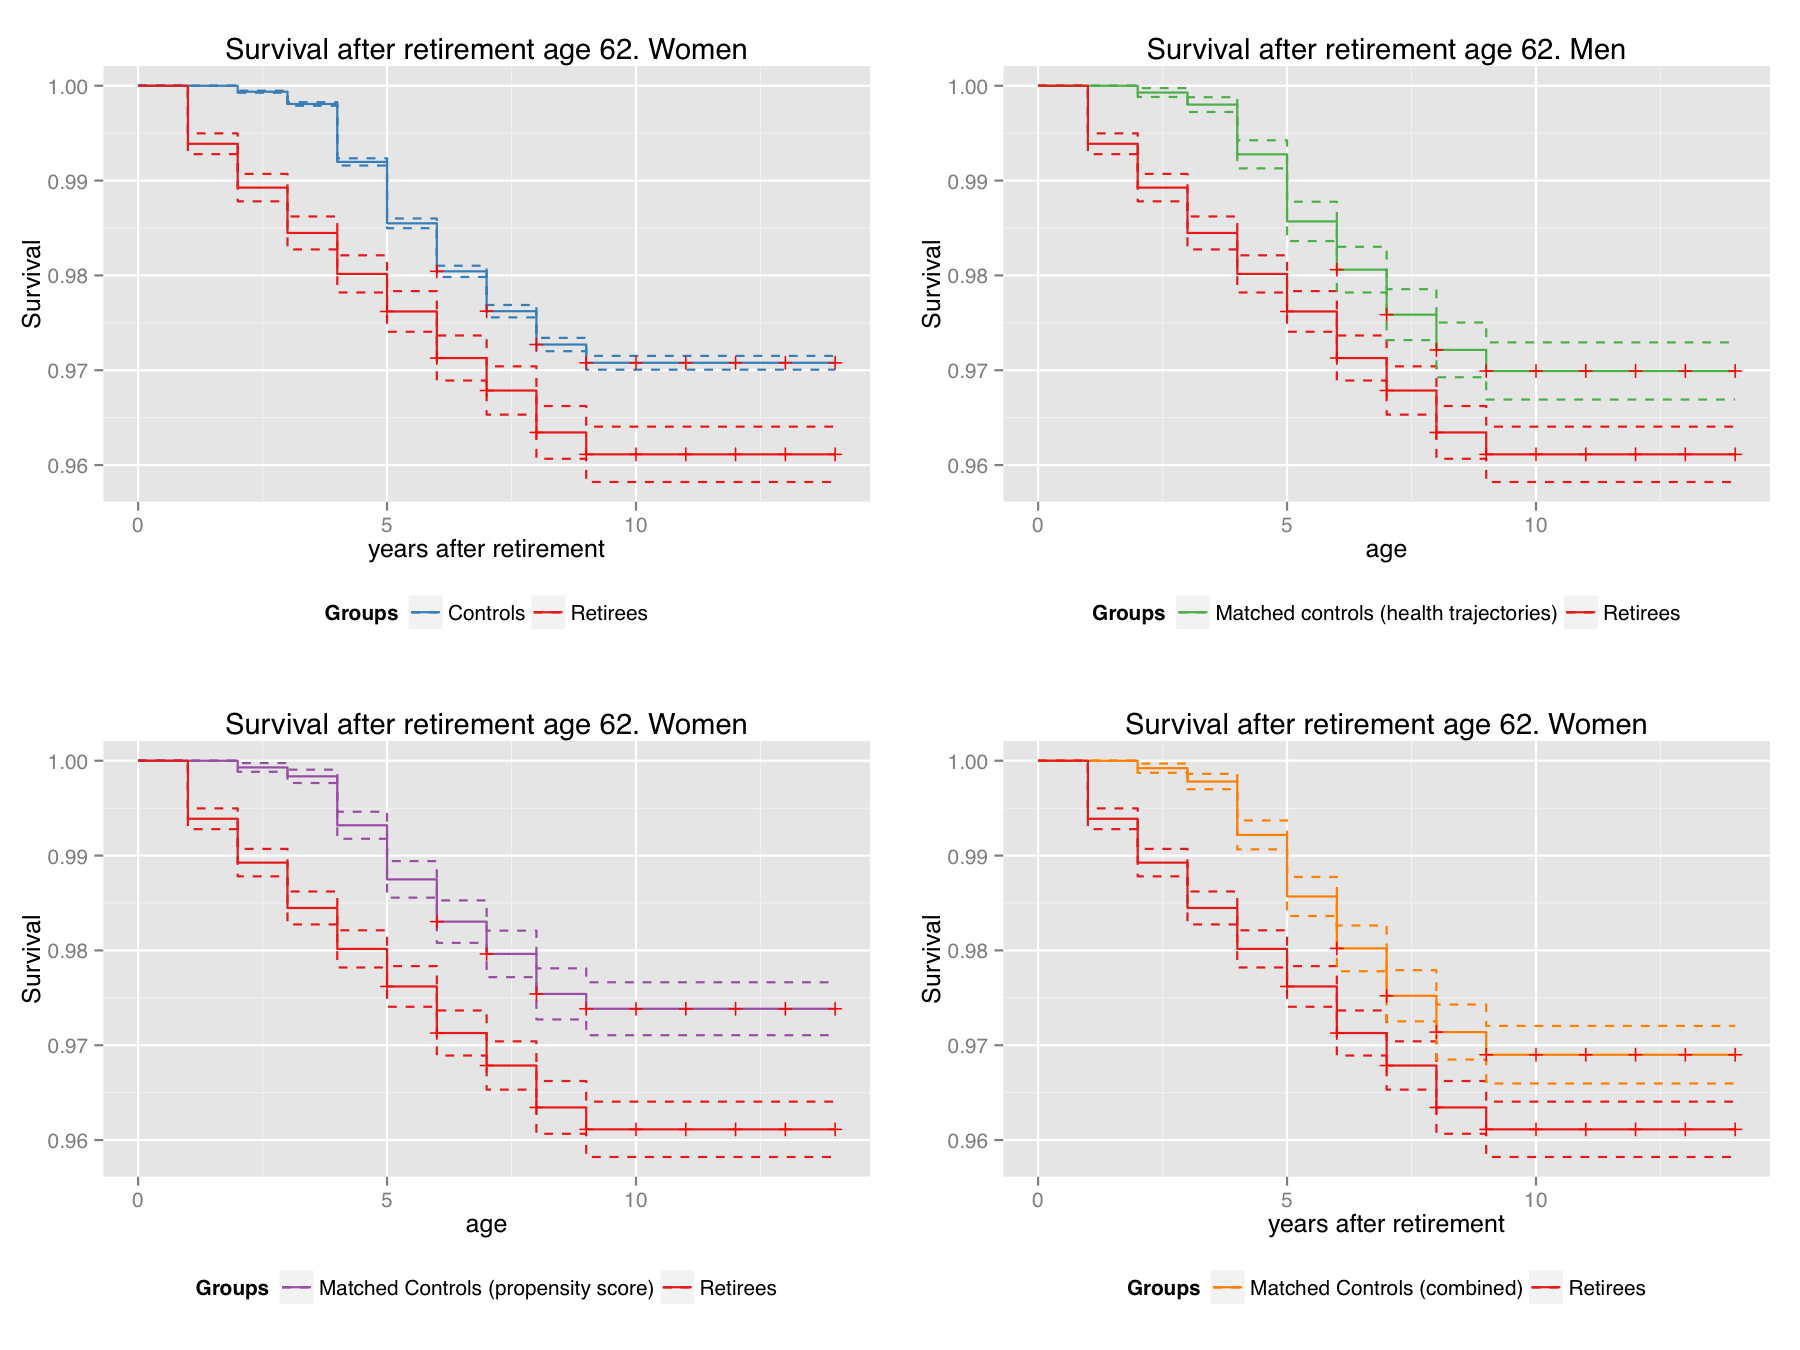
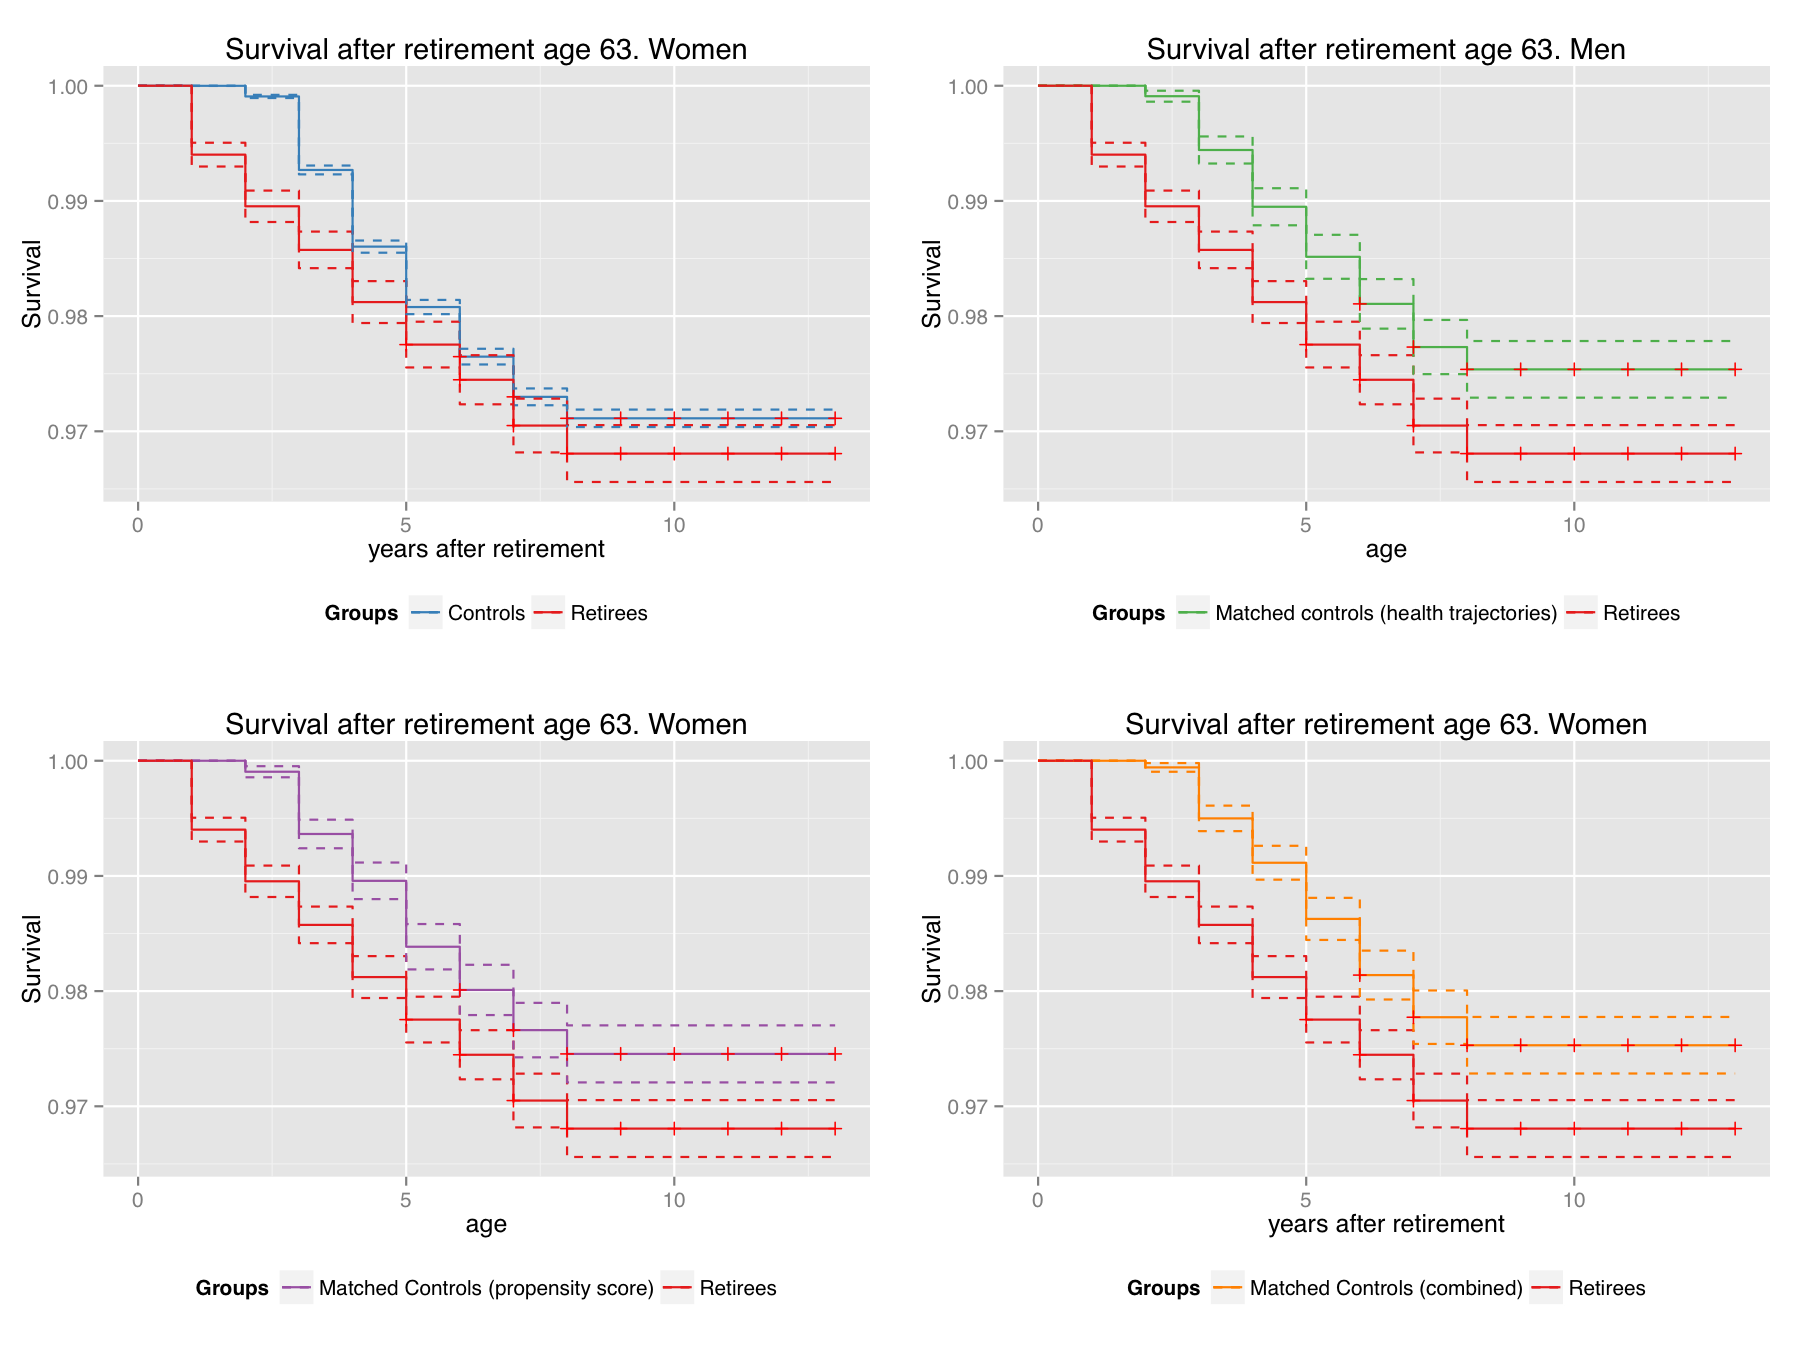
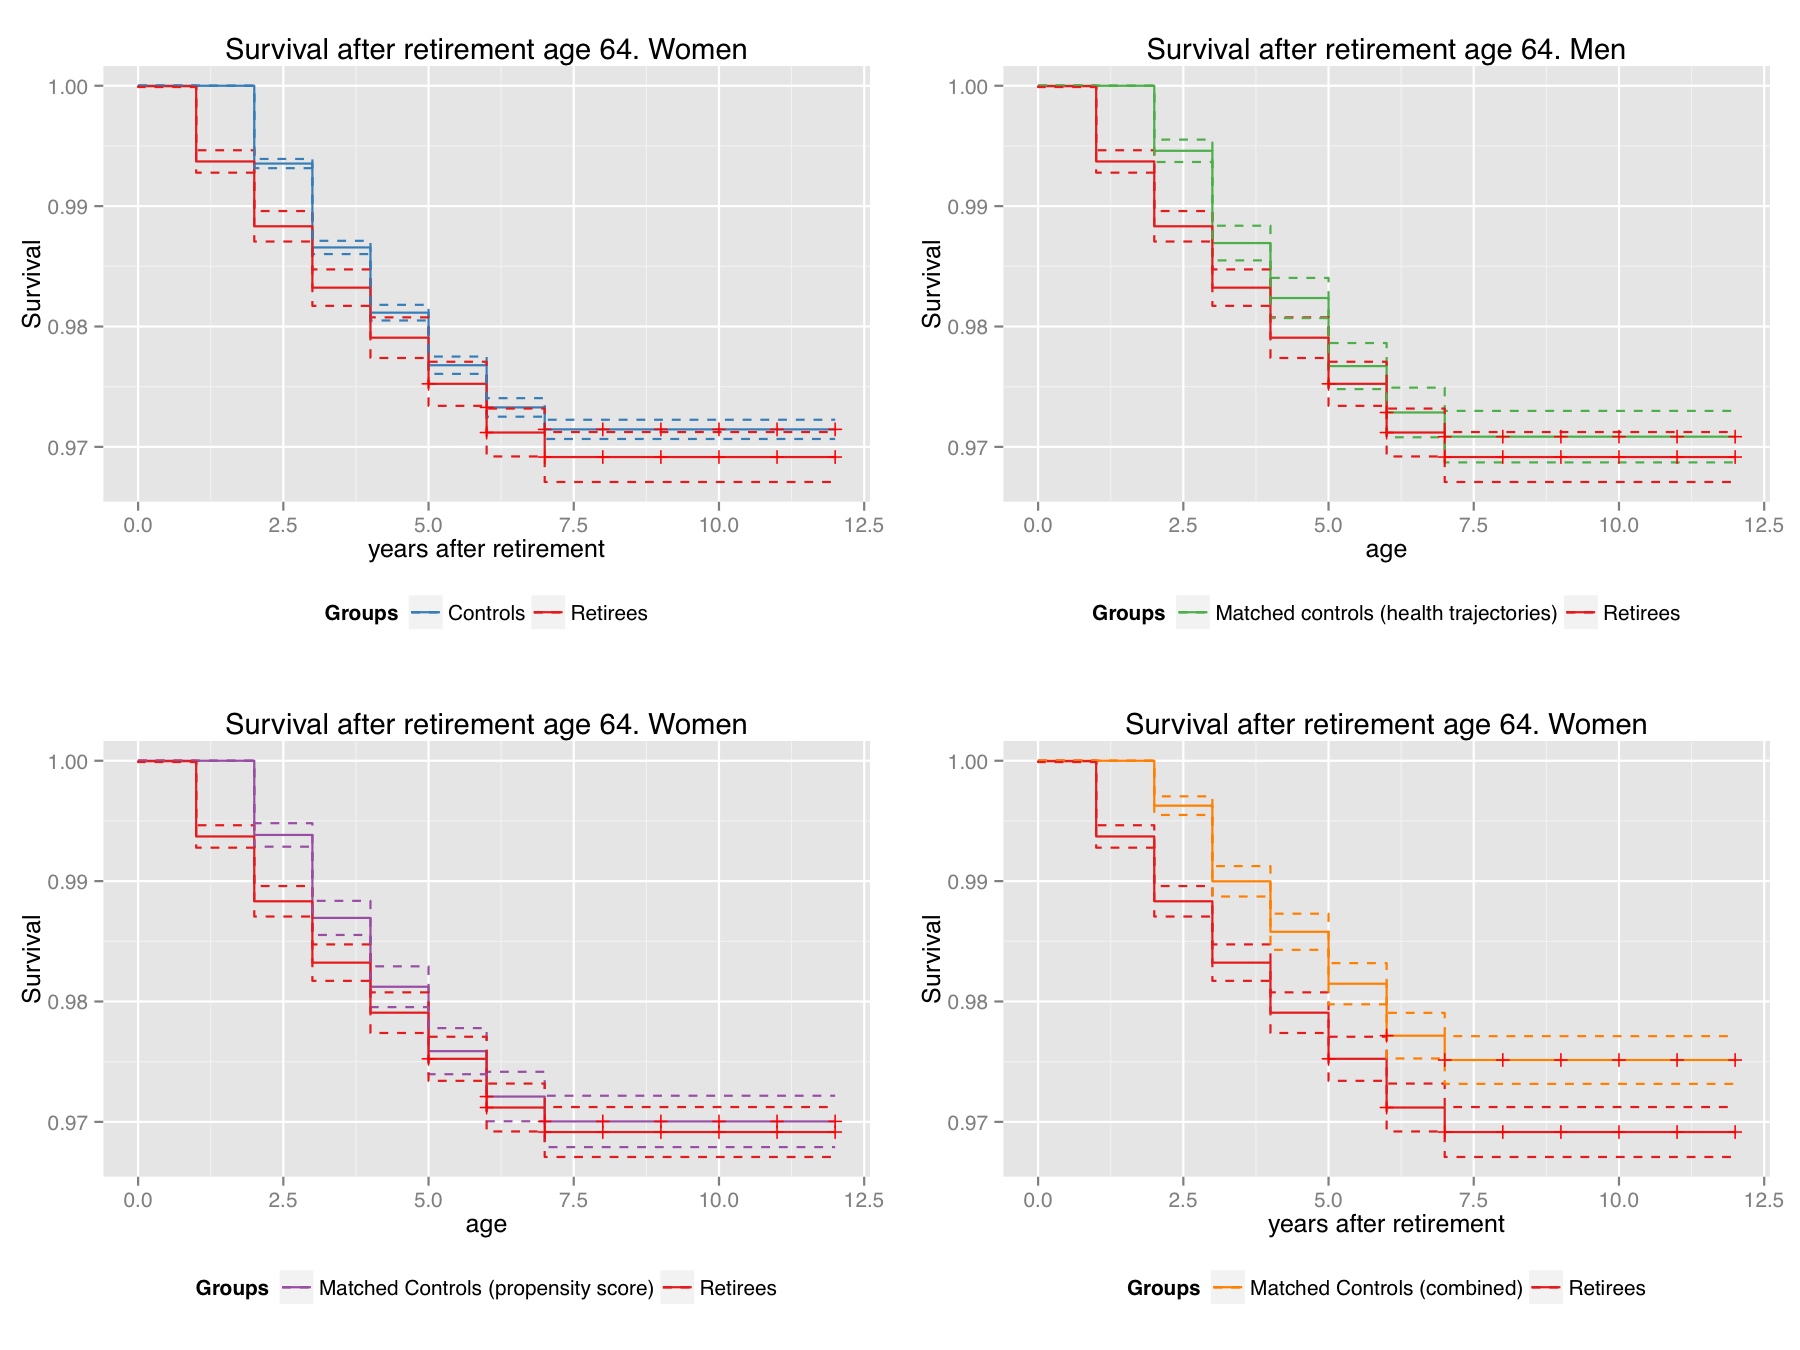
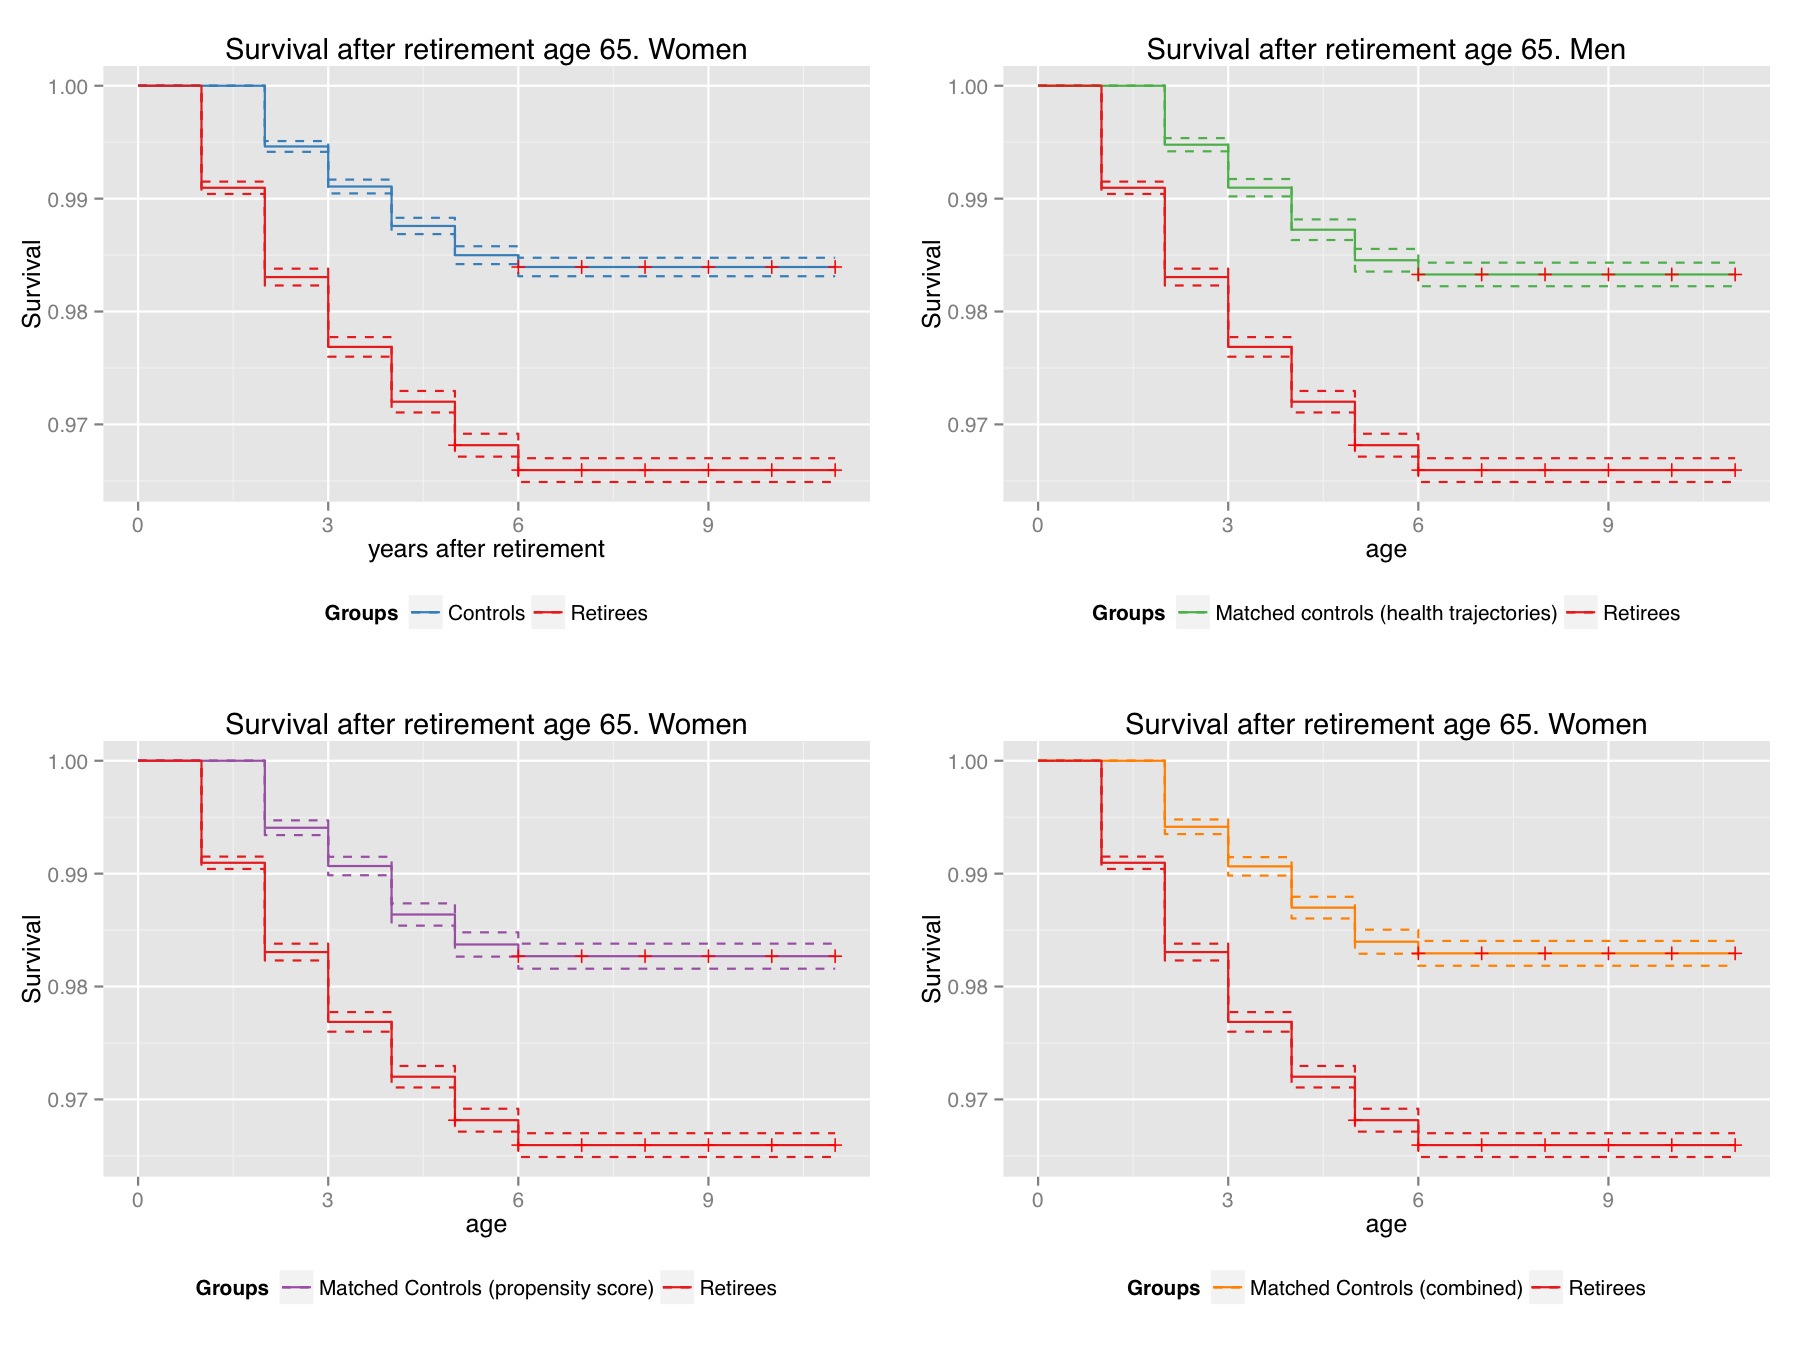
Kaplan-Meier survival estimates by age at retirement. The red line indicates the estimated survival probability of retirees, the orange line indicates the survival probability of the matched control group. Dotted lines indicate 95\% confidence interval.